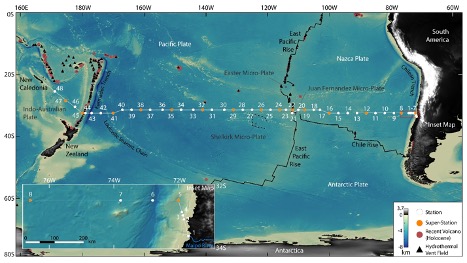
The SO289 research cruise aboard R/V Sonne, which involves the trans-Pacific leg of the GEOTRACES program, is a 48-day expedition consisting of 48 planned CTD cast stations taken at approximately 1-3° intervals all the way from the coast of Chile to the South Fiji Basin (Figure 1). The chief objective of this research cruise is to determine the relative distributions, sources, sinks and isotopic variances of trace elements in the water column along a trans-oceanic section of the South Pacific Ocean. This will be achieved primarily through the use of biogeochemistry and chemical oceanographic methods, as well as, and to a lesser extent, examination of localized variations in physical and biological oceanographic properties. Ultimately, the deliverables from this research cruise will increase current scientific understanding of elemental biogeochemical cycling and related micronutrient interactions/implications as they pertain to ocean productivity and ecosystem function.
CTD Operations
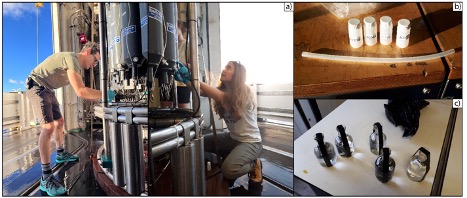
Two Conductivity, Temperature, Depth (CTD) sensors are being used on this cruise, the first being a “clean CTD” with a frame constructed from titanium and all other metal components, such as the cable, enclosed in plastic/rubber to reduce trace-metals contaminants introduced into the water column from our equipment (Figure 2). The second is a stainless-steel CTD, used for collecting water samples where trace-metal contamination isn’t a concern. Both CTDs have numerous sensors attached to their base, which are used to measure parameters such as conductivity (used to interpret salinity), oxygen concentration, pressure (used to derive the CTD’s depth), chlorophyl levels, etc. These CTDs also both contain a rosette sampler (i.e., 24 Niskin bottles attached in a ring around their frame that can all be closed separately on command from the control room), which is what allows us to collect water at specific depth. Each bottle can contain slightly over 10 L of fluid.
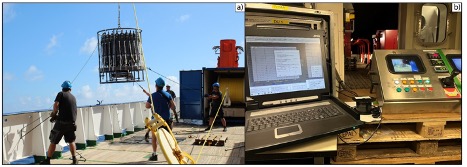
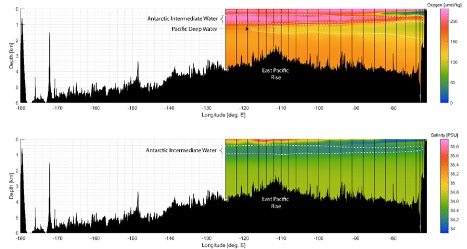
Both of us have been responsible for the collection of water samples with the CTD, Sarah being responsible for collection of the Ti-CTD data and bottle firing, and Chris doing the same for the stainless-steel CTD. Bottles are “fired” (i.e., closed) as the CTD is being raised back up through the water column (called the upcast). During the downcast (initial lowering of the CTD), water property data is collected and displayed live for us to interpret. Before the cast the station chiefs try to best predict the location of the South Pacific’s water masses at that location, but we don’t actually know their depths until the downcast data is displayed (Figure 3). The water masses at depth are determined primarily by the salinity and oxygen concentration anomalies in the water column.
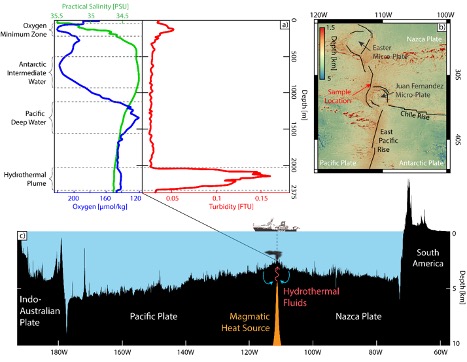
While surveying directly over and near the East Pacific Rise (EPR), the turbidity parameter allowed us to identify at what depth the CTD had passed through a hydrothermal plume. The EPR is an active seafloor spreading center that forms new crust upon spreading. The spreading is driven in part by a subseafloor magmatic heat source that, in addition to the volcanogenic influence, also drives seawater convection within the crust. The progressive heating of infiltrated subseafloor seawater causes chemical exchange to occur between the altered seawater, or hydrothermal fluid, and basaltic oceanic crust. Where hydrothermal fluids are discharged at the seafloor, the change in temperature and redox conditions reduces the solubility for certain minerals, causing the precipitation of chimney-like hydrothermal vent structures and mounds. Upon coming into contact with the cooler seawater the hydrothermal fluids can become dark and cloudy as the solutes it picked up from the crust begin precipitating. These dark, underwater clouds can be measured in the water column by their ability to block light created in the CTD’s turbidity sensor. A high turbidity signal is observed when the CTD is within a hydrothermal plume (Figure 4).
Sampling
Sarah has been collecting ~ 5-20 mL seawater samples from the stainless-steel CTD, creating a sampling array comprised of water column depth profiles at numerous stations for later S isotope analysis at MUN, Lehigh University, and MIT (Figure 5). The goal for these analyses is to better constrain the average seawater sulfate S isotope composition with respect to d34S and ∆33S, as well as to delineate potential water-mass associated isotopic variances in the water column. These S isotope analyses will provide critical insight into global seawater sulfate cycling on modern timescales, and specifically test the idea that global ocean sulfate is homogenous with respect to S isotope compositions. These analyses may also help to provide important context to more high priority GEOTRACES investigations, as water column S isotope inhomogeneities (or lack thereof) may be related to the ecological biogeochemical environment from which they were collected.
In addition to S-isotope sampling, Chris has been collecting dissolved inorganic carbon (DIC) water samples from the CTD casts. From these samples the total inorganic carbon can be measured from a number of levels through the water column, across the South Pacific Ocean. As the amount of carbon dioxide (CO2) gas dissolved in the samples is a component of the DIC, it was important to collect the samples such that they are free of any air within the bottle. They were then poisoned with mercuric chloride (HgCl2) to ensure no organic processes would produce any more CO2 gas before the samples could be analyzed on land. This data is collected regularly across Earth’s oceans to provided information on the amount of anthropogenic carbon being added to the system.
Soluble Trace Metal Filtering
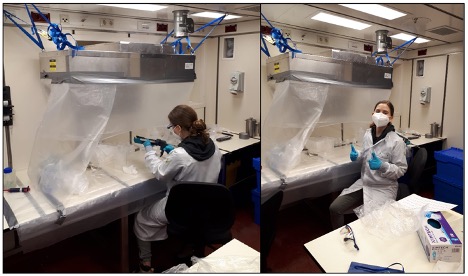
Another of Sarah’s responsibilities has been soluble trace metal filtering. The method is lengthy, taking upwards of ~40 minutes per sample, and physically arduous as it requires repeated manual filtering of HCl, Milli-Q, and seawater through a 0.02 μ filter using a caulking gun (Figure 6). The process is be completed under clean, metal free conditions to avoid contamination.
Multibeam Data Collection & Mapping
As being the physical oceanography/geology team on board we have also been responsible for overseeing and processing the EM122 bathymetric data that the ship collects. The data collection itself is automatic, and mainly controlled by the Sonne’s technical team, but we have been taking the data and processing is for future mapping. As this data is produced only after the ship has sailed over a section of the seafloor, we have been producing coarser resolution maps for station planning using GEBCO data for the scientific crew to use (Figure 1).
Underwater Vision Profiler
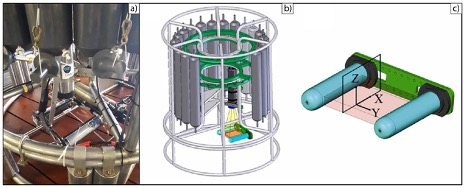
The last of our responsibilities has been doing the underwater vision profiler (UVP) surveying, which is one of the sensors attached to the stainless-steel CTD. The UVP is a high-resolution camera system that shines a thin beam of light horizontally between its two lamps, and then takes rapid pictures of the lit-up water (Figure 7). Based off the reflectance of the light beam within that volume of water the camera can measure the density of macroscopic particles and zooplankton > 100 μm in size. We have been handling the charging, deployment, data collection, and data processing of the UVP during each of the stainless-steel CTD casts.
CREATE Participants: Sarah Moriarty and Chris Galley
Memorial University of Newfoundland, Canada