[deutsche Version unten]
5th Weekly Report SO289
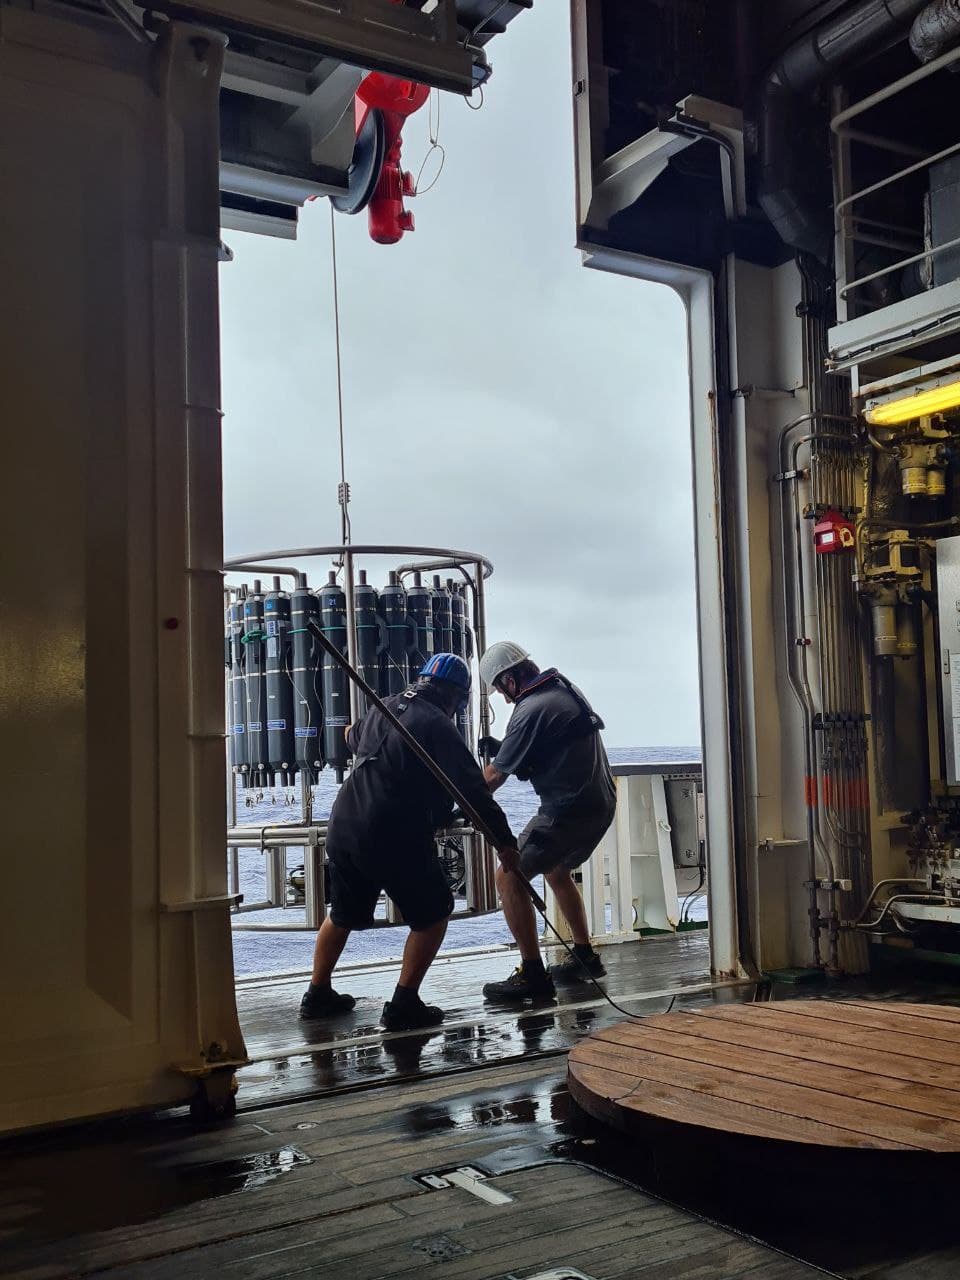
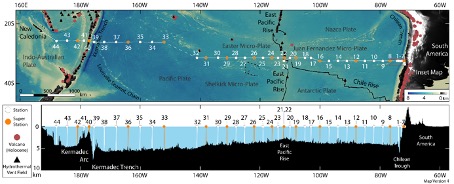
Progress: We have had a successful last few days, following our unplanned detour to Tahiti. We commenced sampling again on Wednesday morning (March 23) just outside the EEZ of French Polynesia and have been able to conduct daily station occupations with CTD casts and in situ pump deployments. In order to optimise ship-time whilst sailing towards Noumea, we have chosen to steam more northerly along a 26°10 S latitude cruise track (instead of 32°30S). This transect allows us to use the shortest transect to New Caledonia and also to avoid entering the EEZ of New Zealand as their responses to our communications for sampling permissions are not answered. The weather has been variable with winds up to force 6-7 Beaufort, and even 10 Beaufort whilst crossing a front, but this has not prevented us to work at the stations. We are currently heading for the Kermadec Trough and its associated hydrothermal systems.
Surface ocean pH and pCO2 observations: The South Pacific Ocean is dominated by a large ultra-oligotrophic gyre. Large regions of the subtropical waters of the South Pacific Ocean are considered a net CO2 sink, operating primarily through the solubility pump, but only few data are available to confirm this. The anthropogenic carbon in the South Pacific Ocean occurs predominantly in surface and intermediate waters of the equatorward flowing Antarctic Intermediate Water (AAIW). The eastern boundary region is characterized by upwelling of CO2 rich subsurface waters.
We collect samples in the water column from surface to the seafloor for land-based analysis of dissolved inorganic carbon and total alkalinity; these measurements will be conducted by Louise Delaigue at Netherlands Institute for Sea Research. Louise is also conducting automated surface ocean pH measurements using an optode electrode system. In addition, GEOMAR/Xiamen PhD student Li Qiu, is conducting continuous surface ocean measurements of pCO2 and pH. The underway measurements are conducted in the ship’s underway supply, which is taking water from a depth of 6.5 m. The pCO2 measurements are conducted every minute, and the sensor is based on infra red detection of CO2 after membrane equilibration (Contros HydroC sensor). The pH sensor measures total pH, using a spectrophotometric technique with meta cresol purple as pH dye. The instrument (Sunburst SAMI pH) conducts a measurement every 15 min along the transect.
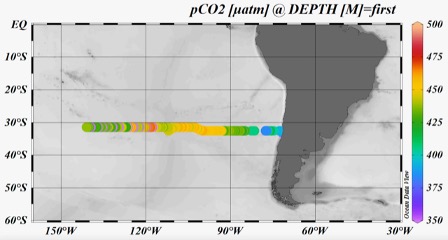
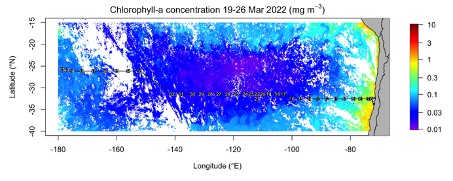
The pCO2 data (Fig. 3) indicates values below current atmospheric pCO2 (ca. 419 ppm) in the vicinity of the Chilean coast as a result of enhanced primary productivity in the nutrient enriched upwelling region (see Fig. 5). The enhanced phytoplankton growth in these waters take up CO2 and thereby remove the high CO2 levels in the upwelling waters and turning the coastal waters into a CO2 sink. Along our transect away from the Chilean coast, pCO2 gradually declined whilst the waters became less productive due to reduced nutrient supply. Consequently, the waters became a CO2 source with pCO2 reaching over 450 μatm in the subtropical gyre. We are now gradually moving out of the ultra-oligotrophic waters towards New Zealand and the productivity appears to be increasing and pCO2 decreasing to atmospheric pCO2 levels and below.
Controls on surface ocean productivity: The study region is almost completely uninvestigated with regards to nutrient limitation; for example the basic experimental data is lacking to demonstrate limitation by nitrogen (N), phosphorus (P), iron (Fe), or other essential micronutrients. Some first-order predictions can be made from available distributions of nitrate and phosphate from the World Ocean Atlas. Calculation of the relative biological excess of P over N (P=[P]–[N]/16) reveals generally positive values throughout the cruise transect, suggesting P is probably significantly ‘less limiting’ than N; however P values declining to <0.05 μM are evident in the central part of the transect— concentrations that have found to be serially limiting (i.e., approaching co-limiting) levels in the tropical North Atlantic. The eastern part of the transect passes through regions with >0.1 μM nitrate, and the presence of residual N is suggestive of (co-)limitation by another nutrient, and given the excess P, strongly indicates insufficient Fe. The low levels of N, P and Fe are the result of low supplies from subsurface and atmospheric sources.
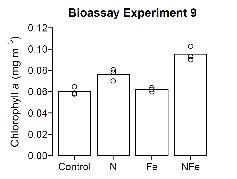
Our team led by Tom Browning, and including Zhongwei Yuan, Haoran Liu, Julaine Tammen and also Zouzhou Wen, are investigating the (micro-)nutrient controls on phytoplankton productivity. The team collects surface ocean waters and incubates the waters for a period of 48 h on deck under controlled light and temperature conditions, following the addition of N, P, Fe and combinations thereof. Various variables, including chlorophyll a are measured following the incubation period. Figure 6 shows the results of an incubation experiment, indicating changes in chlorophyll-a biomass, a pigment found in all phytoplankton, in response to supply of N, Fe, or nitrogen and iron combined (N+Fe) after 48 hours. The experiment is conducted with surface water sample collected in centre of the subtropical gyre. The largest response is seen in response to N+Fe supply, suggesting both of these nutrients are approaching levels low enough to co-limit phytoplankton growth.
RV Sonne at sea 26°10 S/167°5W
Eric Achterberg
GEOMAR Helmholtz Centre for Ocean Research Kiel/University of Kiel
Beobachtungen des pH-Werts und des pCO2-Werts des Oberflächenozeans sowie der (Mikro-)Nährstoffkontrolle der Ozeanproduktivität im Südpazifik
5. Wochenbericht SO289
Fortschritte: Nach unserem ungeplanten Fahrt nach Tahiti haben wir die letzten Tage erfolgreich hinter uns gebracht. Wir haben am Mittwochmorgen (23. März) kurz vor der EEZ von Französisch-Polynesien wieder mit der Beprobung begonnen und konnten tägliche Stationsbesetzungen mit CTD-Einsätzen und In-situ-Pumpeinsätzen durchführen. Um die Schiffszeit auf dem Weg nach Noumea zu optimieren, haben wir uns für einen nördlicheren Kurs auf 26°10 S Breite entschieden (statt 32°30S). Auf diese Weise können wir den kürzesten Transekt nach Neukaledonien nutzen und vermeiden außerdem die Einfahrt in die EEZ Neuseelands, da wir dort keine Antwort auf unsere Anfragen für Probenahmegenehmigungen erhalten. Das Wetter war wechselhaft mit Windstärken bis zu 6-7 Beaufort und sogar 10 Beaufort beim Überqueren einer Front, was uns aber nicht daran hinderte, an den Stationen zu arbeiten. Wir sind derzeit auf dem Weg zum Kermadec-Tief und den damit verbundenen hydrothermalen Systemen.
pH- und pCO2-Beobachtungen an der Meeresoberfläche: Der Südpazifik wird von einem großen ultra-oligotrophen Wirbel beherrscht. Große Teile der subtropischen Gewässer des Südpazifiks gelten als Netto-CO2-Senke, die in erster Linie durch die Löslichkeitspumpe funktioniert, aber es gibt nur wenige Daten, die dies bestätigen. Der anthropogene Kohlenstoff im Südpazifik kommt überwiegend im Oberflächen- und Intermediate wasser des äquatorwärts fließenden Antarktischen Intermediate wassers (AAIW) vor. Die östliche Grenzregion ist durch den Auftrieb von CO2-reichem Tiefenwasser gekennzeichnet.
Wir sammeln Proben in der Wassersäule von der Oberfläche bis zum Meeresboden, um an Land den gelösten anorganischen Kohlenstoff und die Alkalität zu analysieren; diese Messungen werden von Louise Delaigue vom Netherlands Institute for Sea Research durchgeführt. Louise Delaigue führt auch automatische pH-Messungen an der Meeresoberfläche mit einem Optoden-Elektrodensystem durch. Darüber hinaus führt der GEOMAR/Xiamen-Doktorand Li Qiu kontinuierliche Messungen von pCO2 und pH an der Meeresoberfläche durch. Die Messungen werden in der Wasser-Versorgung des Schiffes durchgeführt, das Wasser aus einer Tiefe von 6,5 m entnimmt. Die pCO2-Messungen werden jede Minute durchgeführt, und der Sensor basiert auf der Infrarot-Detektion von CO2 nach der Membran-Equilibrierung (Contros HydroC Sensor). Der pH-Sensor misst den Gesamt-pH-Wert mit einem spektrophotometrischen Verfahren mit Meta-Kresolpurpur als pH-Farbstoff. Das Gerät (Sunburst SAMI pH) führt alle 15 Minuten eine Messung entlang des Transekts durch.
Die pCO2-Daten (Abb. 3) zeigen Werte unterhalb des derzeitigen atmosphärischen pCO2 (ca. 419 ppm) in der Nähe der chilenischen Küste als Ergebnis einer erhöhten Primärproduktivität in der nährstoffreichen Auftriebsregion (siehe Abb. 5). Das verstärkte Phytoplanktonwachstum in diesen Gewässern nimmt CO2 auf und beseitigt so den hohen CO2-Gehalt in den Auftriebsgewässern und macht die Küstengewässer zu einer CO2-Senke. Entlang unseres Transekts weg von der chilenischen Küste nahm der pCO2-Wert allmählich ab, während die Gewässer aufgrund der geringeren Nährstoffzufuhr weniger produktiv wurden. Infolgedessen wurden die Gewässer zu einer CO2-Quelle mit einem pCO2-Wert von über 450 μatm im subtropischen Wirbel. Jetzt bewegen wir uns allmählich aus den ultra-oligotrophen Gewässern in Richtung Neuseeland heraus, und die Produktivität scheint zuzunehmen und der pCO2 auf atmosphärische pCO2-Werte und darunter zu sinken.
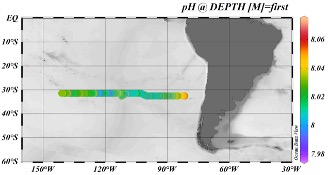
Der beobachtete pH-Trend spiegelt den pCO2-Trend wider. (Abb. 4) Der pH-Wert ist in Richtung der chilenischen Küste am höchsten (pH 8,04-8,06) und sinkt im Zentrum des subtropischen Wirbels auf 8,0 und darunter. Nun bewegen wir uns auf etwas produktivere Gewässer zu, und der pH-Wert steigt aufgrund der CO2-Aufnahme durch das Phytoplankton und eines damit verbundenen Anstiegs des pH-Werts auf pH 8,03.
Kontrollen auf die Produktivität der Ozeane an der Oberfläche: Die Untersuchungsregion ist im Hinblick auf die Nährstoffbegrenzung fast völlig unerforscht; so fehlen beispielsweise die grundlegenden experimentellen Daten, um eine Begrenzung durch Stickstoff (N), Phosphor (P), Eisen (Fe) oder andere wichtige Mikronährstoffe nachzuweisen. Einige Vorhersagen erster Ordnung können anhand der verfügbaren Verteilungen von Nitrat und Phosphat aus dem World Ocean Atlas gemacht werden. Die Berechnung des relativen biologischen Überschusses von P gegenüber N (P*=[P]-[N]/16) zeigt allgemein positive Werte auf dem gesamten Transekt, was darauf hindeutet, dass P wahrscheinlich deutlich “weniger limitierend” ist als N; im zentralen Teil des Transekts sind jedoch P*-Werte zu beobachten, die auf <0,05 μM abfallen – Konzentrationen, die sich im tropischen Nordatlantik als seriell limitierend (d. h. annähernd ko-limitierend) erwiesen haben. Der östliche Teil des Transekts verläuft durch Regionen mit >0,1 μM Nitrat, und das Vorhandensein von Rest-N deutet auf eine (Co-)Limitierung durch einen anderen Nährstoff hin, und angesichts des P-Überschusses deutet dies stark auf einen Fe-Mangel hin. Die niedrigen N-, P- und Fe-Werte sind das Ergebnis einer geringen Zufuhr aus unterirdischen und atmosphärischen Quellen.
Unser Team unter der Leitung von Tom Browning, zu dem auch Zhongwei Yuan, Haoran Liu, Julaine Tammen und Zouzhou Wen gehören, untersucht die (Mikro-)Nährstoffkontrollen auf die Produktivität des Phytoplanktons. Das Team sammelt Oberflächenwasser und inkubiert das Wasser 48 Stunden lang an Deck unter kontrollierten Licht- und Temperaturbedingungen, nachdem es N, P, Fe und Kombinationen davon zugegeben hat.
Nach der Inkubationszeit werden verschiedene Variablen, darunter Chlorophyll a, gemessen. Abbildung 6 zeigt die Ergebnisse eines Inkubationsexperiments, das die Veränderungen in der Chlorophyll-a-Biomasse, einem Pigment, das in allen Phytoplanktonarten vorkommt, als Reaktion auf die Zufuhr von N, Fe oder einer Kombination aus Stickstoff und Eisen (N+Fe) nach 48 Stunden anzeigt. Das Experiment wird mit Oberflächenwasserproben durchgeführt, die im Zentrum des subtropischen Wirbels gesammelt wurden. Die stärkste Reaktion ist bei der Zufuhr von N+Fe zu beobachten, was darauf hindeutet, dass sich diese beiden Nährstoffe einem Niveau nähern, das niedrig genug ist, um das Wachstum des Phytoplanktons zu begrenzen.
RV Sonne auf See 26°10 S/167°5W
Eric Achterberg
GEOMAR Helmholtz-Zentrum für Ozeanforschung Kiel/Universität Kiel