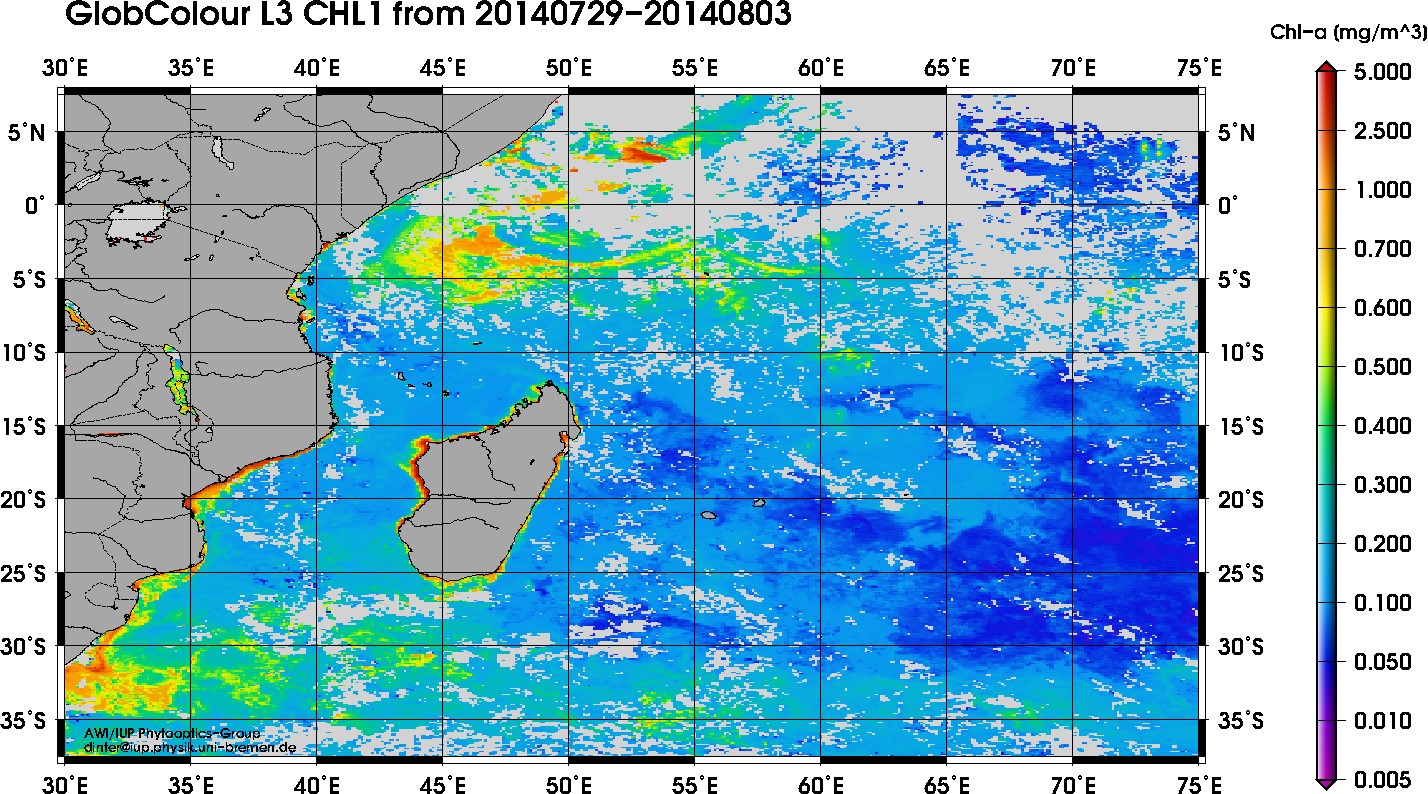
Figure 3: Chlorophyll-a (mg/m3) map from 29.07.-03.08.2014 (Image by Astrid Bracher and Tilman Dinter, AWI/ IUP).
Der Blog umfasst die Expeditionen SO234-1 und SO235 im Indischen Ozean / This blog comprises the scientific cruises SO234-1 and SO235 in the Indian Ocean. More info
Figure 3: Chlorophyll-a (mg/m3) map from 29.07.-03.08.2014 (Image by Astrid Bracher and Tilman Dinter, AWI/ IUP).