4th weekly report (12.02.2023 – 18.02.2023)
Saturday 18th February 2023
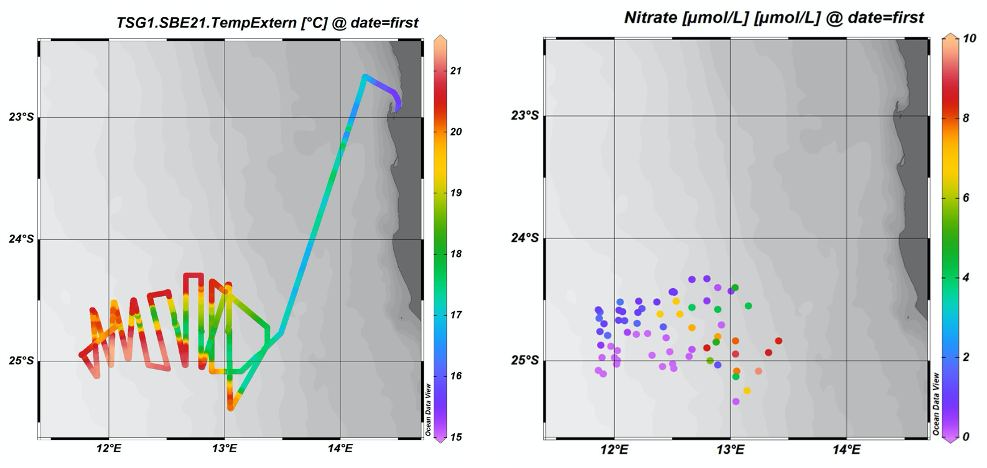
In our fourth week we continued our study of the second filament located west of Lüderitz, conducting daily stations to sample the water column and then using the remainder of the day and night for intensive underway sampling of surface seawaters. We are studying the cold, nutrient-rich water that has upwelled to the surface and how this water evolves chemically and biologically as it is advected offshore within filaments. As part of the regular underway sampling, we are collecting samples for dissolved nutrient concentrations (nitrate, phosphate, silicate, and ammonium) that are analysed directly onboard. Initially, nearer the coastal upwelling zone, nutrient concentrations in filaments are at very high levels, but as phytoplankton (microscopic plants in the surface ocean) take up the nutrients to grow, the remaining dissolved concentrations in seawater are drawdown. We therefore see both strong gradients in nutrient concentrations between both inside and outside of the filaments as well as along them.
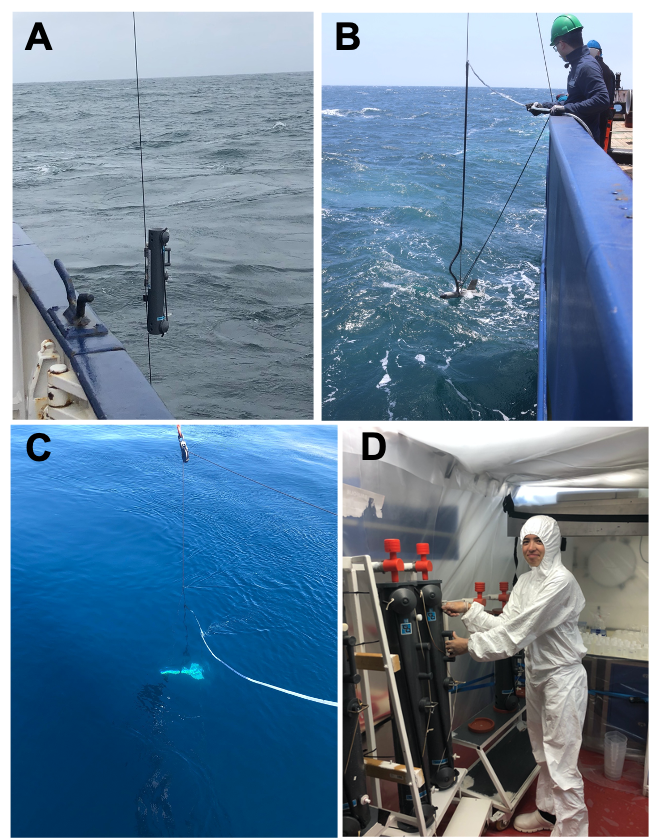
In addition to the major nutrients (for example, nitrate and phosphate), phytoplankton also require a range of essential nutrients in small quantities, the so-called micronutrients. These micronutrients include a range of trace elements such as iron, zinc, cobalt, and manganese. At every site where we are collecting samples for major nutrients, we are also collecting samples for micronutrient concentration analysis. Collection of these samples is not straightforward, as the samples are highly prone to contamination. To sample from the water column, we use all-plastic sampling bottles (‘Go-flos’) that are fitted onto a plastic line, whereas samples from the surface are collected from a towed device that pumps seawater through plastic tubing onto the ship. All of the plastics in the equipment used for collecting this seawater have been previously soaked in acid and then washed in deionized water, which removes contaminating trace elements that are stuck onto the plastic surfaces. Furthermore, once the seawater is onboard, we must process the samples in an environment that is free from dust and other airborne particles. To do this we have built sampling ‘bubbles’ in two of the ship’s laboratories, plastic rooms over-pressurized with filtered air. Unlike the major nutrient samples (nitrate, phosphate and silicate), we cannot analyse these onboard: we will take these samples back to GEOMAR where they will be processed to concentrate the trace elements and then analyse them by mass spectrometry.
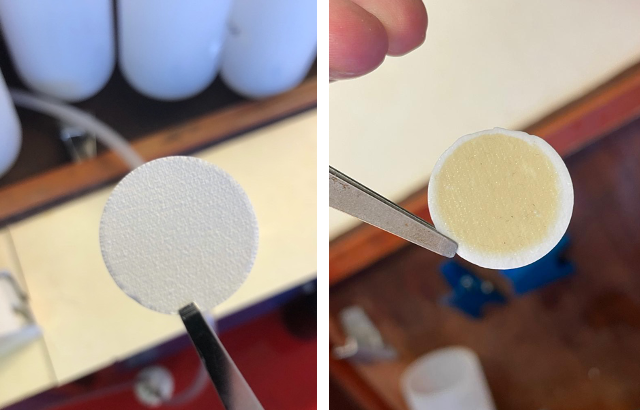
Matching the gradient in nutrients are concentrations of phytoplankton themselves, with higher concentrations at the start of the filament and lower concentrations further offshore. In addition to the overall amounts of phytoplankton, two teams on board are collecting samples to identify the types of phytoplankton present. This is important, as different types of phytoplankton have very different biogeochemical functions; for example, some are relatively large (20-200 µm diameter) and can take up nutrients rapidly and grow very fast (diatoms) and have silicate shells that result in them sinking quicker in the water column, whilst others are more adapted to low nutrient conditions either as a result of their tiny size (down to ~0.5 µm diameter), which increases their surface area-to-volume-ratio for nutrient uptake, or by their ability to acquire nutrients from pools that are difficult to access, such as those bound strongly to organic matter. On returning the samples back to the home laboratories a variety of techniques will be used to identify the phytoplankton present in the seawater and how this varies through the filaments. Firstly, we will analyse a range of pigments that are diagnostic of different types of phytoplankton. Secondly, we will analyse the numerical abundance of different types of cells having specific fluorescence and scattering properties using flow cytometry. Thirdly, we will assess in detail the relative abundance of different phytoplankton types using genomics (that is, identification of specific microbes via detection and identification of diagnostic genes). All of these methods have different advantages and drawbacks—but by undertaking this range of approaches this will give us a very good picture of the phytoplankton community that was present.
On 16.02 we came to the end of our second filament study. The next chapter of our research cruise has started, which is to conduct a transect outwards to the central South Atlantic in order to cross the full biogeochemical gradient from upwelling to subtropical gyre conditions. Stations will be conducted each day, with a spacing of 1.4 degrees (~140 km) until 5°W.
There continues to be excellent cooperation between the scientists and Captain Korte and team, the food is very good and although we have had slightly increased wind and swell for the latter part of this week the weather has in general been favourable.
Tom Browning
GEOMAR Helmholtz Centre for Ocean Research Kiel