The mystery of light has confounded humanity since the dawn of civilization, we have made leaps and bounds in our understandings but are still unsure what it is, is it a wave? A particle? A quanta? Some weird amalgamation of all and none of these? When even Einstein and Feynman say they don’t know and it’s best to not dwell on it, well you know you’re in some confusing territory. However, so long as we give a wide berth to quantum mechanics and narrow our focus only at how light interacts with objects like the ocean and its constituents, then we should be safe.
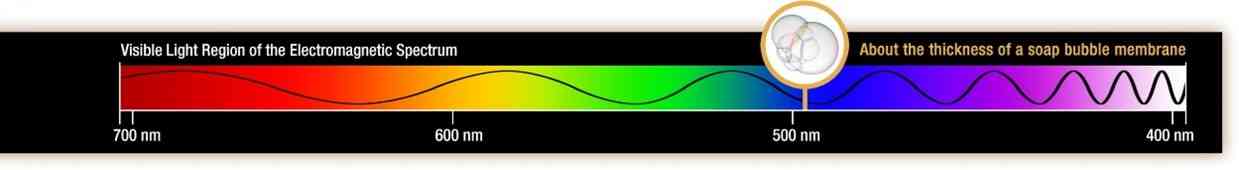
One of the largest discoveries of light which you are probably most familiar with is Newtons discovery that white light from the sun was in fact made up of a rainbow of colours. After many years of iterations and particle vs. wave debates, we now have the electromagnetic spectrum we’re all familiar with, with visible light existing between 380 – 700nm. Every object you have every looked at in the world is given its unique color because of how light absorbs, reflects, and interacts with it. The sky is blue because blue light refracts the most off of all the particles in the earth’s atmosphere. The ocean is blue because seawater really likes to absorb all the other colours in the spectrum more. “But the ocean isn’t always blue” I hear you say, well that’s true, particles and matter in the water can change how it interacts with light. For example, lots of sediment and dirt in the water can make it appear brownish, while large populations of algae can make it appear greener.
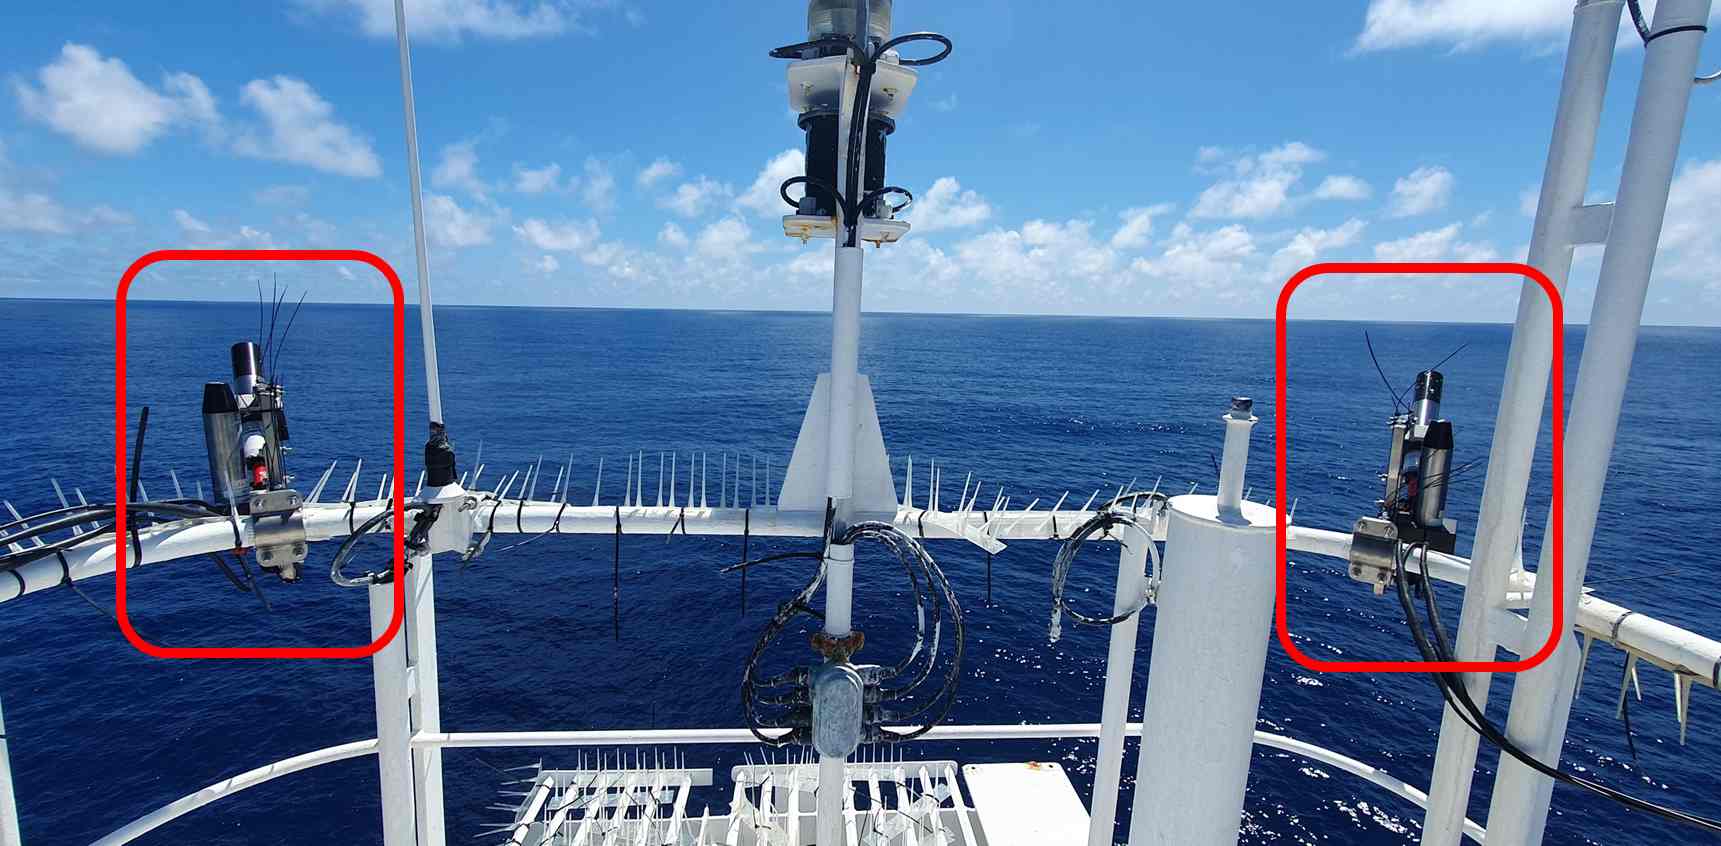
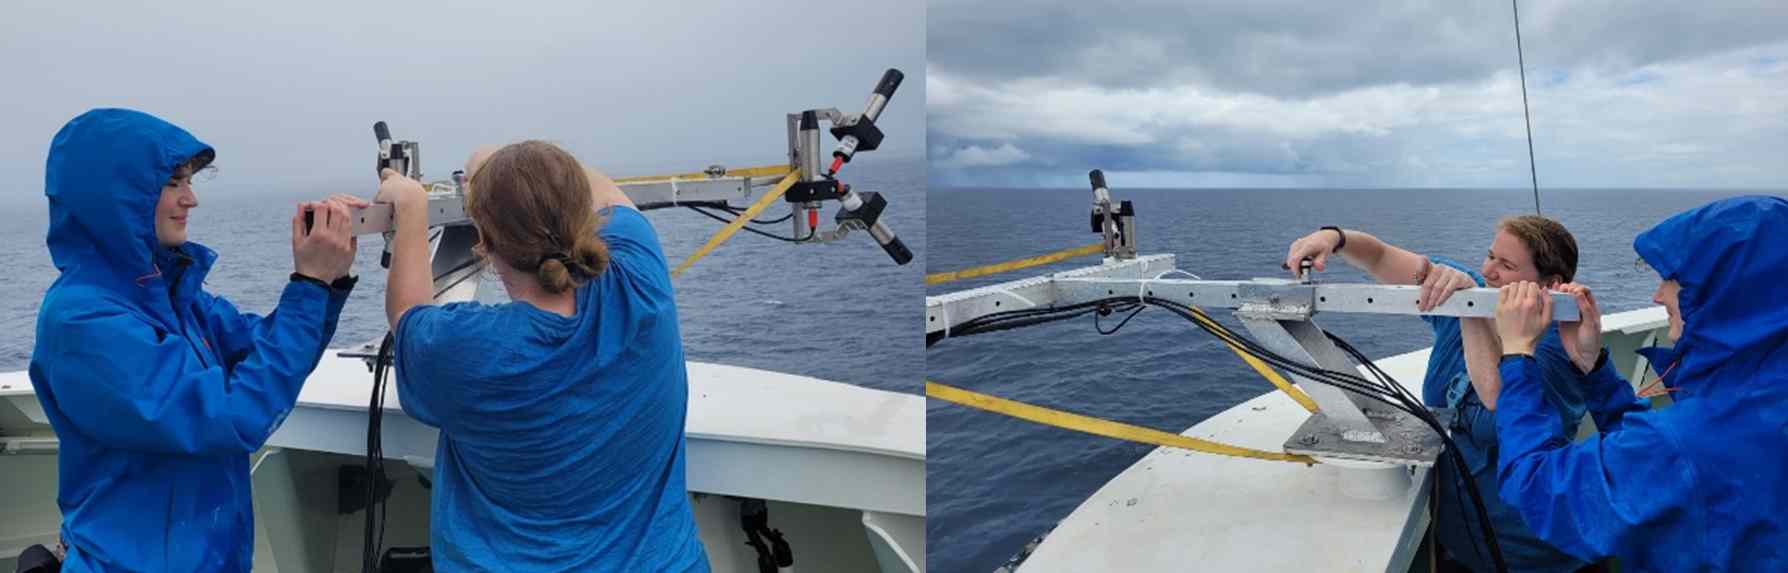
So, what does that have to do with me? Well, as a part of the Ocean Glow project, I’m using multiple sensors (radiometers and irradiance meters) to record the passive fluorescence signal coming out of the ocean. Radiometers measure the radiant flux (power) of electromagnetic radiation, i.e., they measure the energy of light. Now I have hyperspectral radiometers which means they measure many wavelengths in the electromagnetic spectrum, from 300nm to 900nm, so I get a very high resolution signature of the light coming from the ocean, the full rainbow if you will. I also have radiometers pointed at the sky and irradiance meters measuring the total light coming in. I need all this information so that I can calculate the fluorescence being emitted by Chlorophyll a from phytoplankton.
See phytoplankton, like terrestrial plants, take up light energy from the sun (plus water and CO2) and turn that into O2 and energy for themselves, Chlorophyll a is used heavily in this process and thus re-emits light based on how many phytoplankton are present and how much photosynthesizing they’re doing, among other factors. Recently we’ve noticed that phytoplankton also emit different amounts of light depending on if they are in Iron stressed but Nitrogen replete conditions. The Pacific Ocean is then a perfect area to study this as it has a large Nitrogen replete/Iron limited area, surrounded by a Nitrogen limited and Iron replete area with intermediate levels of limitation between the two.
During the SO298 cruise I am recording the passive fluorescence signature coming from the ocean as we move from these Iron limited waters towards co-limited and Nitrogen limited waters to detect how the fluorescence signature changes and why. Hopefully we will be able to use this data in the future, in combination with satellite data to detect nutrient regimes in the ocean via their fluorescence signature. For now, I am enjoying watching how the colours of the ocean change as we go, ever shifting rainbows of light coming from the water and all the life within it.
by Tiera-Brandy Robinson