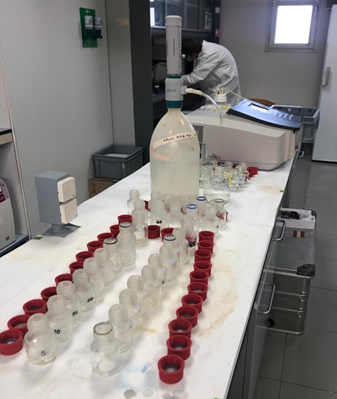
In my last post, I described how we take samples from our mesocosms and how the filtration for particles inside the water is done afterwards. Now, some people may ask: Why is all this done? Would it not be enough to just filter the water one time? What are all these different filters used for in the end? So, here comes the answer: The ocean is very complex and even if it seems like it from above, this blue, huge body of water is far from being empty at all. It is full of information, which are invisible for the naked eye, but once discovered, each of it is telling its own private story, allowing us scientists to immerge deeper and deeper into its mysteries and searching for more and more secrets to be unraveled. With this we can improve our understanding of the ocean, giving us new hints and possibilities how to use and protect its magnificent beauty. This may sound a little bit simple now, but in fact, exactly this hidden information in our samples allow us in the end to get an idea about plankton taxonomy, nutrient cycles, trophic transfer or food quality. All these parameters enable us in the end to evaluate how the system of the mesocosms changed over time and whether ocean alkalinization is efficient or could have any unforeseeable side-effects or not. To get a better idea about the parameters analyzed let’s go through them step by step:
Chl a and HPLC (Chlorophyll a and High performance liquid chromatography):
Many small organisms in the water use different colored pigments to absorb sunlight and use it to produce energy – just like plants on land. To get a rough idea about the distribution of these photosynthetic algae, summarized as phytoplankton, we measure chlorophyll a, which is one of the most common pigments and important to perform photosynthesis. Whatsoever, chlorophyll a is only one of much more than seventy different pigments occurring in algae. Depending on the algae group there are specific pigment combinations, allowing to conclude on the algae composition as well as on the biomass distribution among the different groups at time of sampling. To receive this information, high performance liquid chromatography (HPLC) will be used back in Kiel to separate the components available in the samples.
However, when working with pigments the handling of the samples up to the analyzation is quite important. Pigments don’t like light or better they like it too much and directly react with it. To prevent the destruction of the pigments by light before analyzation, the filtration rags are kept dark and the filters are covered afterwards. In case of the chlorophyll a, the analysis is done on site. For this acetone is used to extract the pigments from the filtrates. Afterwards either photometric determination with a spectrometer or at low concentrations the more sensitive fluorometric determination with a fluorometer is done. At the first method light of a specific wavelength is sent through the sample and the reflection is measured. For the fluorometric determination, the fluorescence, the emission of light from a substance after absorbing light is measured. The intensity and wavelength of this fluorescence gives information about presence and concentration of a specific compound.
BSi (Biogenic silica):
Biogenic silica is an important parameter to get information about a special group of phytoplankton, the diatoms. These tiny creatures are globally distributed and contribute to around 25 % of the primary production on the planet. Besides the normal nutrients, especially dissolved silicate is needed by the diatoms. Why is that? Diatoms are like the knights of the ocean. They protect their organic components with a shell build-up of silicate (also called amorphous or biogenic silica). If these nutrients are available diatoms become very dominant, suppressing other phytoplankton groups and forming large blooms within a region.
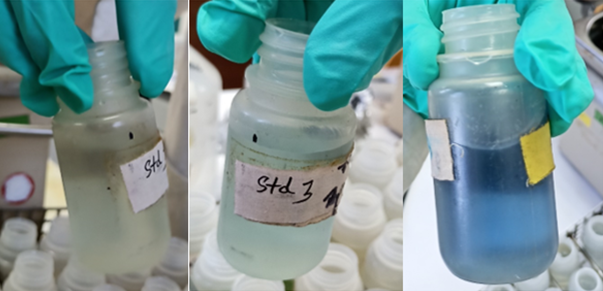
However, there is one big danger when you want to measure silicate, and that’s glass. Glass contains silicate and would thus increase the levels at analyzation. Therefore, a separate filtration rag is used for silicate which contains no glass (e. g. in form of glass fiber filters, glass bottles, etc.), as well as special filters made of cellulose acetate. The analysis of the filters after the filtration is done colorimetrically (measurement of color) by adding different chemicals, which leads to a change of the solution into a blue color when it contains silicate. The higher the concentration of silicate, the darker the color of the solution. The different intensities of the colors are than analyzed with a spectrometer. The higher the concentration and thus intensity of the color, the more reflection.
Fatty acids and Fatty acids < 20 µm:
Like the name indicates, fatty acids are, among others, the main compounds when it comes to fat- and tissue construction in an organism, in fact every organism’s cell is surrounded by a membrane containing among others so called phospholipids, a special type of fatty acids. Analyzing the fatty acid content in our samples will therefore give important information about the trophic transfer, so how food and therefore energy is passed, in our mesocosms. Additionally fatty acids can also be used as group-specific markers for example for algae groups like diatoms or dinoflagellates.
TPC and TPC < 20 µm (Total particulate carbon):
This parameter is closely related to the parameter following next, but includes all kinds of particulate carbon, organic- (e.g. proteins, lipids, carbohydrates or nucleic acids) and inorganic ones (e.g. bicarbonates or carbonate). Maybe as a small side note: What is the difference between dissolved and particulate materials? It’s more or less a practical determination: All materials passing through a filter of 0.7-0.22 µm pore size are seen as dissolved, whereas all substances filtered out are named as particulate.
POC and POC < 20 µm (Particulate organic carbon):
Organisms consist of many different substances of which nitrogen, oxygen, hydrogen, phosphorous and carbon are among the most important ones. Carbon alone, already contributes to around 40 % of the organic substance and can therefore be used as a measure of organic matter quantity. Besides that, the particulate organic nitrogen (PON) is a major indicator of planktonic growth and will be measured alongside with TPC and POC too. Also, when POC is not analyzed here at site, the special treatment preparation will stick in mind: At first, after filtration each filter is acidified with hydrochloric acid to preserve the sample and prevent any further decay and then dried in a drying oven. Secondly, after drying each filter needs to be folded into the size of little “Wrap-like” pellets and is packed in to tin foil to be “ready for delivery”, like we are jokey calling it. This delivery means that the pellet will be burned at very high temperatures to be than analyzed with gas chromatography in an element analyzer equipped with a thermal conductivity detector. This sounds quite complicated, but mainly means that the samples become volatilized and are than separated in different steps into the different compounds they consist of. Through this the concentration of carbon and nitrogen in the sample can be detected. For the POC < 20 µm samples the water is pre-filtered by a 20 µm filter before the main filtration to eliminate all larger organisms and leftovers.
SEM (scanning electron microscope):
These filters are used for a special type of electron microscope, the so-called scanning electron microscope, which scans the surface of an object with a focused beam of electrons. This gives an idea about surface topography and composition of the sample analyzed. In our case we use this technique to identify small planktonic organisms like Coccolithophores (lovely called Coccos), single cell algae, which are part of the phytoplankton in the ocean. Due to their hard shells, consisting of calcium carbonate plates around them, they are important for formation of particulate rocks (like the Cliffs of Dover, England), which are formed when the shells of the dead Coccos accumulate in the ocean sediments. In case of our filtration, these shells remain on the filter and can then be “detected” by the SEM and become visible on the filter. Here, the wonderful, hidden beauty of this fragile shells is revealed. Besides that, also other organisms with hard shells or inorganic precipitates could be analyzed for their structure with this method.
TPP (Total particulate phosphorous):
As mentioned above, another major nutrient in the ocean is phosphorus. The most of you probably heard already about problems with phosphate from washing detergents. Unfiltered waste waters running into for example the Baltic Sea up to the late 70s/80s of the last century had a tremendous effect on the ecosystems. Extreme algae blooms and oxygen limitation were the results of this eutrophication. This already shows how important phosphorous is for biomass development in the ocean, not only for algae, but for all organisms, because phosphorous is a main compound of DNA and other nucleic acids. So, phosphorus is essential for life, but often quite rare in the ocean. For this reason, it is important to know about phosphate concentrations to get an idea about conditions for growth in a particular place. Total particulate phosphorous consists of the inorganic particulate phosphorous (mainly phosphorous bound to other minerals or particles) and organic particulate phosphorous (phosphorus in living or dead organisms). The (dissolved) phosphate is measured with another method, which is described in the blog post by Juliane: ”Nutrients – the base of every food web”..
Looking at the analysis of TPP the main problem with particulate phosphate is that cannot be measured directly. Therefore, it needs to be converted at first. For this, different substances are added and the solution is boiled in a pressure cooker. At the end, the particulate phosphorous, now turned into inorganic dissolved phosphate, is measured colorimetrically with a spectrometer, like in the case of the BSi: The bluer the solution turns, the higher is the concentration.
Author: Jannis Hümmling