Part 1: Why chase clouds
Imagine you would like to have a nice barbeque on Sunday but the weather report seems quite undecided whether it will rain or not. You wonder: “How hard can it be to predict if it rains? It seems like the forecasts are always off!”.
As scientists, we face this challenge on a daily basis. It turns out that the difficulty in predicting rain is due to the massive difference in scales that are involved in its formation: Large cloudy patches can span thousands of kilometers but, at the same time, rain drops form due to the collisions of individual cloud droplets about 1/100 of a millimeter in size. At present, no simulation in the world can resolve both these very large scales and very small scales simultaneously. If one were to capture one cubic centimeter (1 cm x 1 cm x 1 cm) of a typical cloud and took a magnifying glass to it, they would find about 100 cloud droplets in this volume on average! (in reality, it would be difficult to see the particles with a magnifying glass and that is why we use lasers and high-resolution cameras to see the droplets).
One solution to the problem is called “parametrization” which simply means that we compute the large-scale movements of clouds down to a certain size, for example a few kilometers, and then tell the simulation to assume a single number, a parameter, for everything that is smaller. One example for such a parameter is the number of collisions of cloud droplets per volume. It tells us how fast the raindrops would grow from cloud droplets, which are tiny water drops that are not yet large enough to start falling as rain drops due to gravity.
A difficulty here is that clouds are inherently turbulent. Turbulent vortices move the droplets around and force them into clusters or might divert them from their path. Cloud turbulence levels are very high and are notoriously difficult, if not impossible, to replicate in a laboratory or in simulations. The lab would need to be extremely large due to turbulence being driven by the largest length involved in its creation and simulations struggle with a so called “non-linearity” which in practice means that huge amounts of computational power are needed. Therefore, measurements of real clouds are still needed to get these parameters.
Part 2: Practicalities of chasing clouds
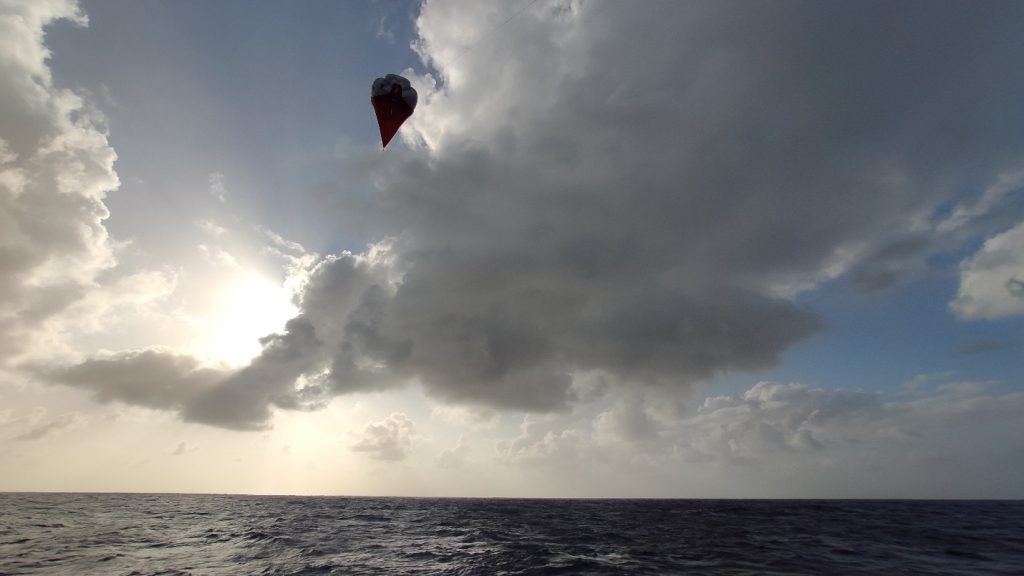
Let’s say that you come up with a neat idea for a new instrument that measures the movement and velocities of cloud droplets and all you need to do for that is get your instrument into a cloud. What is described here is – in somewhat simplified form – the idea of the MPI DS* Cloudkite project . You check the average cloudiness (how much of the sky is covered by clouds at a given moment) and learn that at any given time 68 percent of the Earth is covered in clouds. “That’s great!”, you think. “All I need to do is to hang my instrument from a balloon and then wait for the clouds to come to me”.
* Max Planck Institute for Dynamics and Self-Organization, Göttingen, Germany
You then attach your instrument to your balloon, hope that everything runs smoothly (which it usually doesn’t – at least not initially) and wait… Only to find learn that the cloudiness does not tell you the whole story: Clouds come in many different forms, sizes and thicknesses and are found on the surface (as fog) all the way up to about 80 kilometers high (as noctilucent clouds). The mentioned 68 percent contain all clouds on all heights and might include many thin clouds.
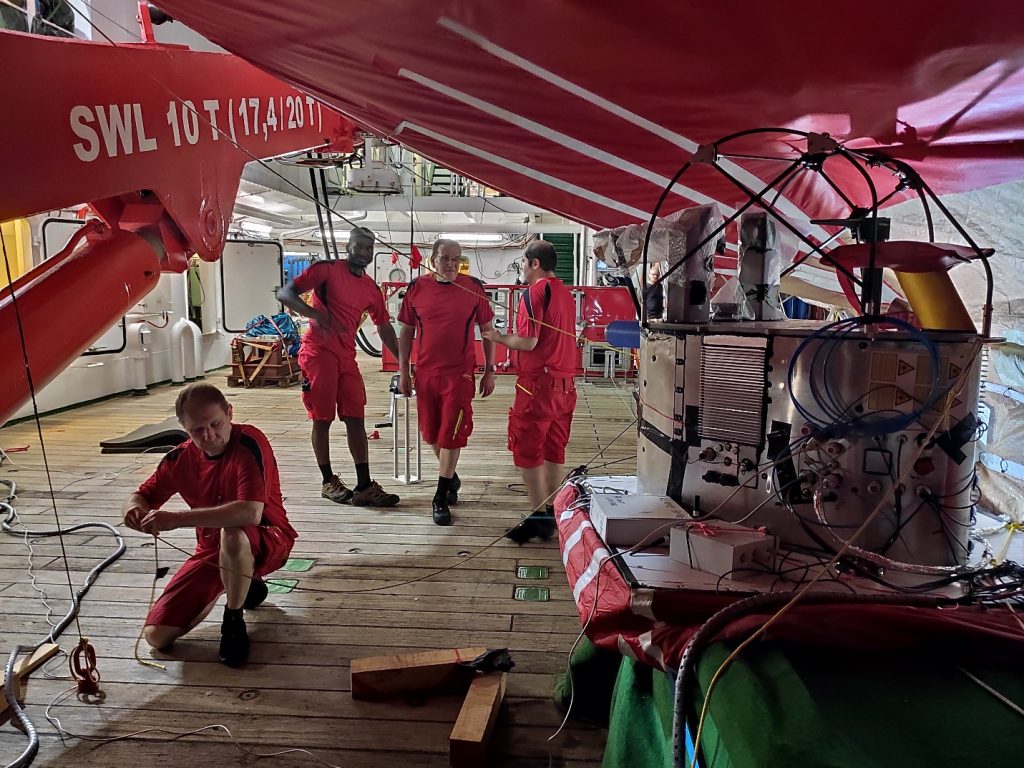
Thankfully, the majority of clouds are found in the lower layer of the atmosphere, the troposphere, which ranges from the ground to up about 7-20 km, with the lower value being the minimum around the poles the higher value being the maximum around the equator. Most clouds are found above the planetary boundary layer, a turbulent layer, anywhere between 100 m to 2 km in height, which often marks the cloud base (the bottom border of the clouds). Our balloon is tethered to a long and lightweight line. With it, we can reach up to 2km in height which makes it ideal to measure this lower part of the clouds.
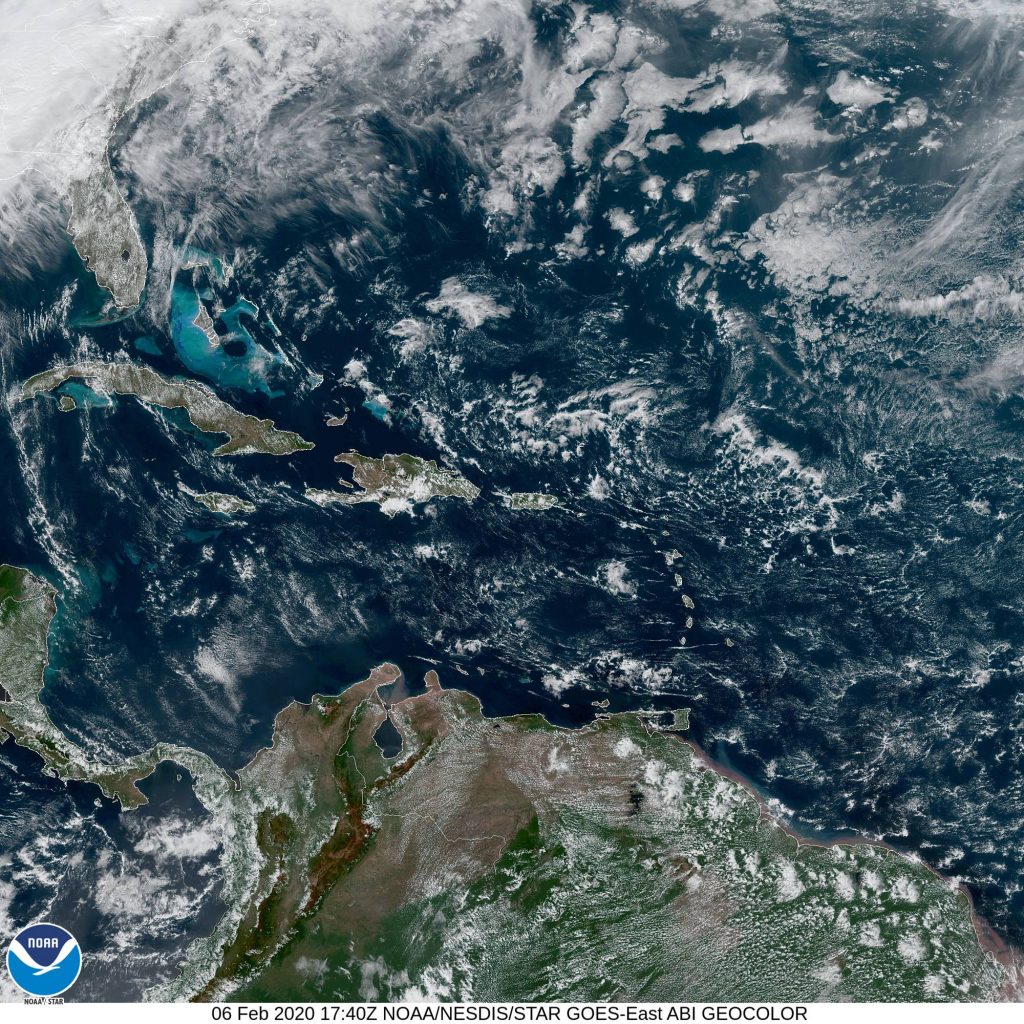
During the Eurec4a campaign, much of our time is spent trying to estimate the current cloud location from radar, lidar and satellite images as well as current predictions for low cloud coverage. We’re typically seeing values between 15 – 25 percent coverage. Battery life is a restricting factor, so care must be taken when choosing to turn on our highest power consuming instruments. Unfortunately, it also takes some minutes to prepare the lasers of those instruments for firing. What we are looking for is a consistent recurrence of clouds, not just a single small puff that is gone as soon as we see it on our screens.
Being on a research ship such as the Maria S. Merian comes with an advantage, as we’re able to actively chase some larger clouds. Often there is a prevailing wind direction, which helps us to estimate the direction a cloud will travel. We’d communicate with the captain and, if lucky, arrive at a given cloud within 10-15 minutes. Quite a bit of guess work is needed to estimate the correct height for the balloon as even if we’re hitting a rain cloud, we want to be in the right height where we can see the creation of the rain drops and not too low or too high where we miss this process. It also takes a lot of commitment to run such an experiment 24/7 and therefore night shifts and lots of coffee/tea are involved in chasing the clouds. In the end, we have been lucky quite a few times by now and looking forward to sharing our results with the scientific community and the public soon!
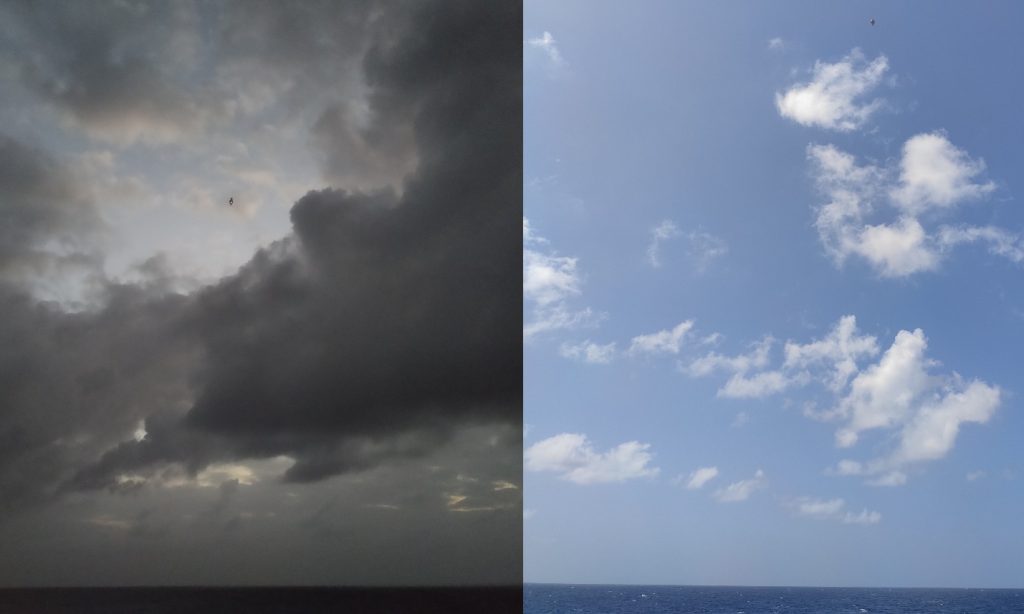
Expectation vs. (often) reality when chasing clouds. Small dot: Cloudkite balloon
Johannes Güttler