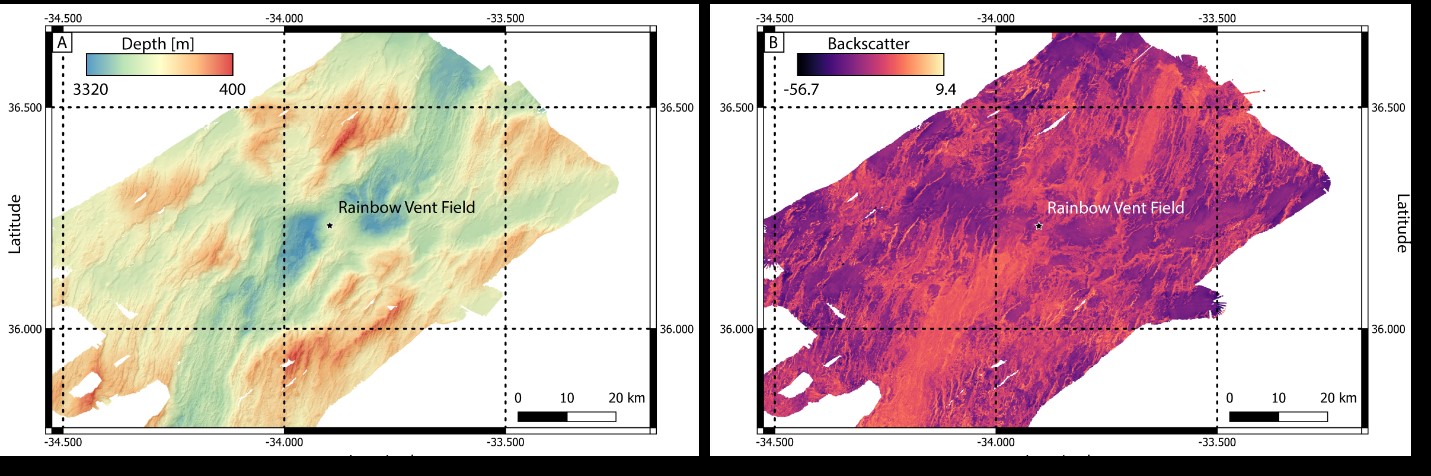
Hello, my name is Chris Galley, and I’m a geophysics PhD student from Canada assisting with the collection and processing of the ship’s acoustic-based imaging data, and mapping. These acoustic methods all measure some feature of the water column, seafloor, or sub-seafloor by releasing pressure waves (sound pings) and then studying the waves upon their return. The ship’s multi-beam bathymetric system is one of these acoustic systems, which can measure the travel times of the released pressure waves to determine the depth and geometry the seafloor beneath the ship (Fig. 1A). Additionally, upon analyzing the intensity of the returning waves (its backscatter data) one can also determine whether the underlying seafloor is sediment-covered (would absorb more of the wave’s energy) or exposed rock (that would better reflect the wave back to the ship, Fig. 1B).
The second acoustic method utilized during this cruise is that of the Parasound system, which is a near-bottom seismic imaging method used to see sediment layering close to the seafloor. With a resolution of 0.5 m and penetration depth of tens of meters it is ideal to determine areas of the seafloor that contain deep sedimentary layers for sampling (Fig. 2A).
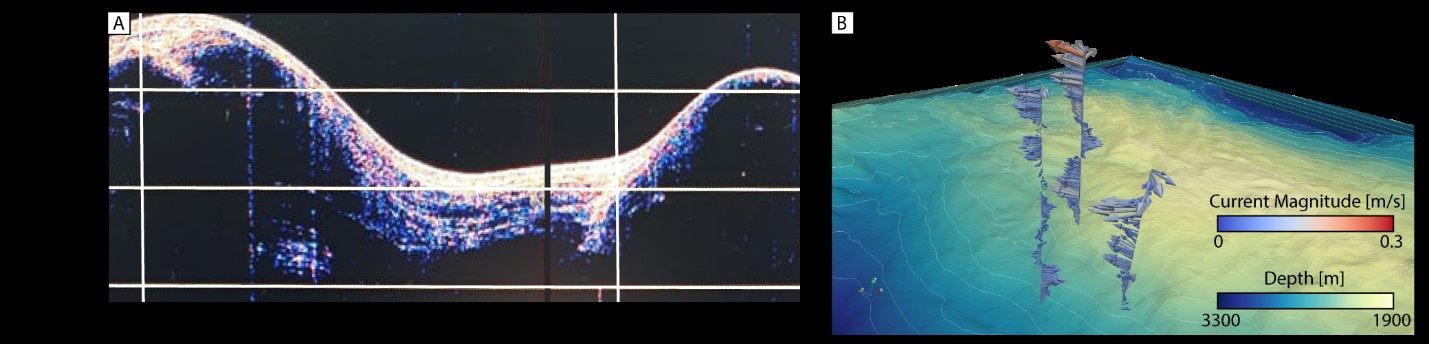
The last acoustic method being used during the cruise is a Lowered Acoustic Doppler Current Profiler (LADCP), that can measure horizontal current directions. Our LADCP is attached to one of the Conductivity Temperature Depth (CTD) device frames and lowered through the water column, allowing us to measure the direction that water is flowing down the length of a profile from the ship to the seafloor (Fig. 2B).
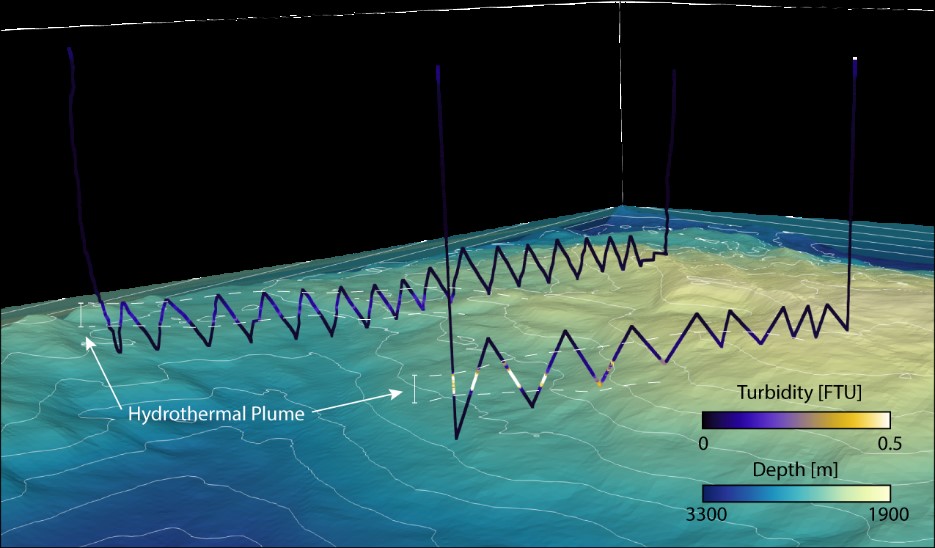
Aside from managing the geophysical methods I have been helping out with the collection of “tow-yo” data, which entails dragging a CTD sensor behind the ship, raising and lowering it through the hydrothermal plume produced by Rainbow. The sensor measures several parameters, but the one that best shows the hydrothermal plume is turbidity, which signifies the amount of “stuff” clouding up the water, making it less clear. Zones of high turbidity will have murkier water, and in our study’s case this means the sensor is in the plume (Fig. 3).
We still have another six days above the hydrothermal field, then will continue collecting data from stations down-stream of the vent field until the end of the month. Already this cruise has been very informative, we have mapped out the hydrothermal plume more than previous studies. Personally, much of my research has investigated the sub-seafloor processes and features of these hydrothermal vent systems, so spending this time in studying the effects hydrothermal vents have on the ocean has been really interesting.