*a guest entry by Laura Raeke, Max-Planck-Institute for Meteorology, Hamburg*
Above surface…
While the most scientists on board of the RV Meteor on cruise M127 are interested in seismic and geological processes under the sea(floor) surface, there are also measurements going on in the other direction: above surface, into the sun.
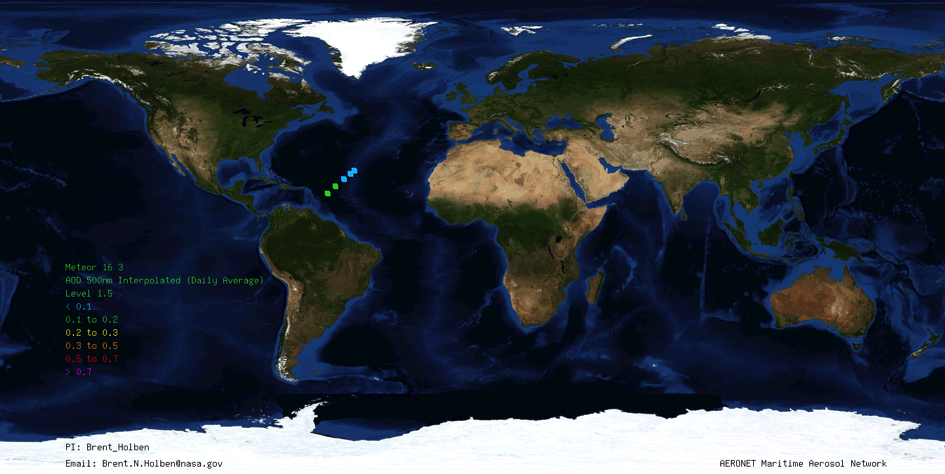
The task is, to analyze the optical thickness of aerosols with a sun photometer, which has to be pointed directly into the sun every 15 minutes (Fig. 1). Aerosols are tiny particles in the atmosphere, and depending on the geographical position, the aerosol amount can vary. For example, in big cities the aerosol amount can reach several millions per cubic centimetre, but in pole regions the aerosol amount can be pretty low with only ten per cubic centimetre. However, these tiny particles are very important for our climate system, because they act as condensation cores referring to the developments of clouds and rainfall. There are still gaps in the aerosol data, especially above the oceans, as maritime aerosol measurements can only be realized from vessels or islands. With cruise M127, from Bridgetown (Barbados) to Ponta Delgada (Acores, Portugal), it is possible to fill gaps in data (Featured Image and Fig. 2). Further, there is the possibility with up to 50 measurements per day, to get new knowledge of a certain daily development over sea (e.g., Are the values higher during lunch time, when the sun is brighter?). Additionally a cloud camera takes pictures every minute for a certain period directly above the RV Meteor (installed on the ships mast). Afterwards the entire data collection will be send to the Max-Planck-Institute for Meteorology in Hamburg and to the NASA-GSFC (Goddard Space Flight Centre) in Florida.
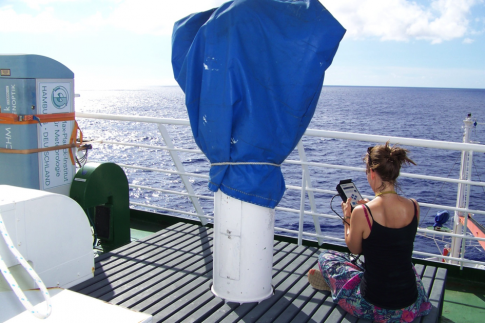
Fig.1: It’s forbidden to shake! Realization of aerosol measurements with a sun photometer on the RV Meteor. / Abb.1: Wackeln verboten! Durchführung der Aerosolmessung mit dem Sonnenphotometer auf dem Forschungsschiff Meteor (Foto: A. Raeke).
——
*Gastbeitrag von Laura Raeke vom Max-Planck-Institut für Meteorologie, Hamburg*
Über der Wasseroberfläche…
Während die meisten Wissenschaftler an Bord dieser Reise an seismischen und geologischen Vorgängen unter der Wasseroberfläche am TAG Hydrothermalfeld auf dem mittelatlantischen Rücken interessiert sind, werden auf dieser Fahrt aber auch Messungen in die entgegengesetzte Richtung, das heißt zur Sonne hin, durchgeführt.
Untersucht wird dabei die optische Dicke von Aerosolen mit Hilfe eines Sonnenphotometers, welches wenn möglich alle 15 Minuten zum Einsatz kommt und direkt auf die Sonne gerichtet wird (Abb. 1). Bei Aerosolen handelt es sich um winzige Schwebeteilchen in der Luft, die je nach geographischer Lage in der Anzahl unterschiedlich ausfallen können. So kann in Großstädten die Anzahl von Aerosolen pro Kubikzentimeter in die Millionen gehen und in den Polregionen hingegen bei nur 10 Aerosolen pro Kubikzentimeter liegen. Diese winzigen Teilchen sind für das Klimasystem jedoch von großer Bedeutung, denn sie fungieren als Kondensationskerne bei der Wolken- und Niederschlagsbildung. Für die Aerosolverteilung auf dem offenen Meer gibt es noch viele Datenlücken, da die Messungen nur auf Schiffen und Inseln möglich sind. Mit dieser Reise M127 von Bridgetown (Barbados) nach Ponta Delgada (Azoren, Portugal) können nun weitere Datenlücken gefüllt werden (Titelbild und Abb. 2). Die täglich bis zu 50 Messungen mitten auf dem Atlantik werden weitere Erkenntnisse über einen möglichen Tagesgang auf See bringen. Mit einer Wolkenkamera wird zeitweise zusätzlich jede Minute das Wolkenbild über dem FS Meteor aufgezeichnet. Anschließend geht die gesammelte Datenmenge an das Max-Planck-Institut für Meteorologie nach Hamburg sowie an das NASA-GSFC.
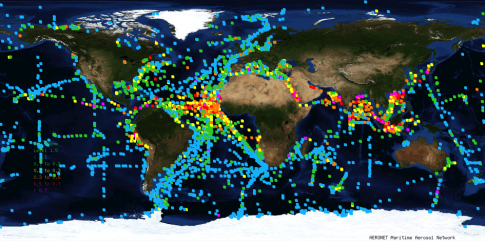
Fig2.: Distribution of aerosols over oceans. Higher values (in the colours yellow, orange, red and pink) in the Atlantic indicate the dust from the Sahara and the Passat wind. / Abb.2: Die Aerosolverteilung auf den Weltmeeren. Die höheren Werte (in den Farben Gelb, Orange, Rot und Pink) im Atlantik zeigen den Sahara Staub des Passat Windes an (Foto: Screenshot von http://aeronet.gsfc.nasa.gov/new_web/maritime_aerosol_network.html).
——
Additional links:
Website to follow the distribution of maritime aerosols on cruise M127. / Link zur Ansicht der maritimen Aerosol Verteilung auf der Fahrt M127: http://aeronet.gsfc.nasa.gov/new_web/cruises_new/Meteor_16_3.html
Website to follow the distribution of maritime aerosols worldwide over oceans. / Link zur Ansicht der maritimen Aerosol Verteilung weltweit: http://aeronet.gsfc.nasa.gov/new_web/maritime_aerosol_network.html