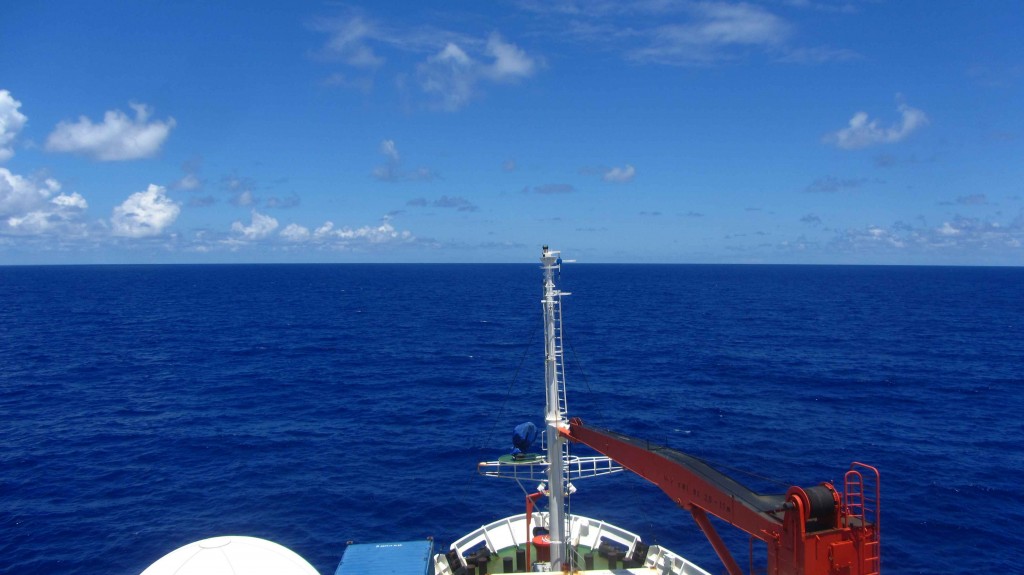
Heading of 50 degrees. Northeast. Speed of 10 to 11 knots. Calm, blue sea. Now and then, a bird flies by. Nothing has really changed for three days, and it will stay like this for another two days, until we reached our target area, the TAG hydrothermal field. To go there, a plane would need less than four hours. The Meteor needs about five days.
So, why do we sail to such a remote place?
The TAG hydrothermal field lies on the Mid-Atlantic Ridge in about 3500 m of water depth. The field consists of several known inactive, but also active hot springs, that emit hot, and metal-rich fluids with more than 350°C temperature. Because of this, the TAG hydrothermal field gives us the unique opportunity to study, what happens to active hydrothermal fields once activity ceases. Do they oxidize and dissolve back into seawater? Do they remain unchanged at the seafloor for millions of years, slightly buried under a thin cover of sediment or lava? How much material is actually out there? Such studies are difficult to do, since we lack technologies to find inactive sites under a thin cover of sediment or basalt. During our cruise we want to test some technologies to overcome this problem and to look back in time, e.g. further away from the young ridge axis.
How we solve this problem and what we will do to answer our questions will be content of following blog entries (also here), when we reached our target area.
Until then, we continue our way to TAG, and let the multi-beam echosounder run to map the seafloor beneath us.
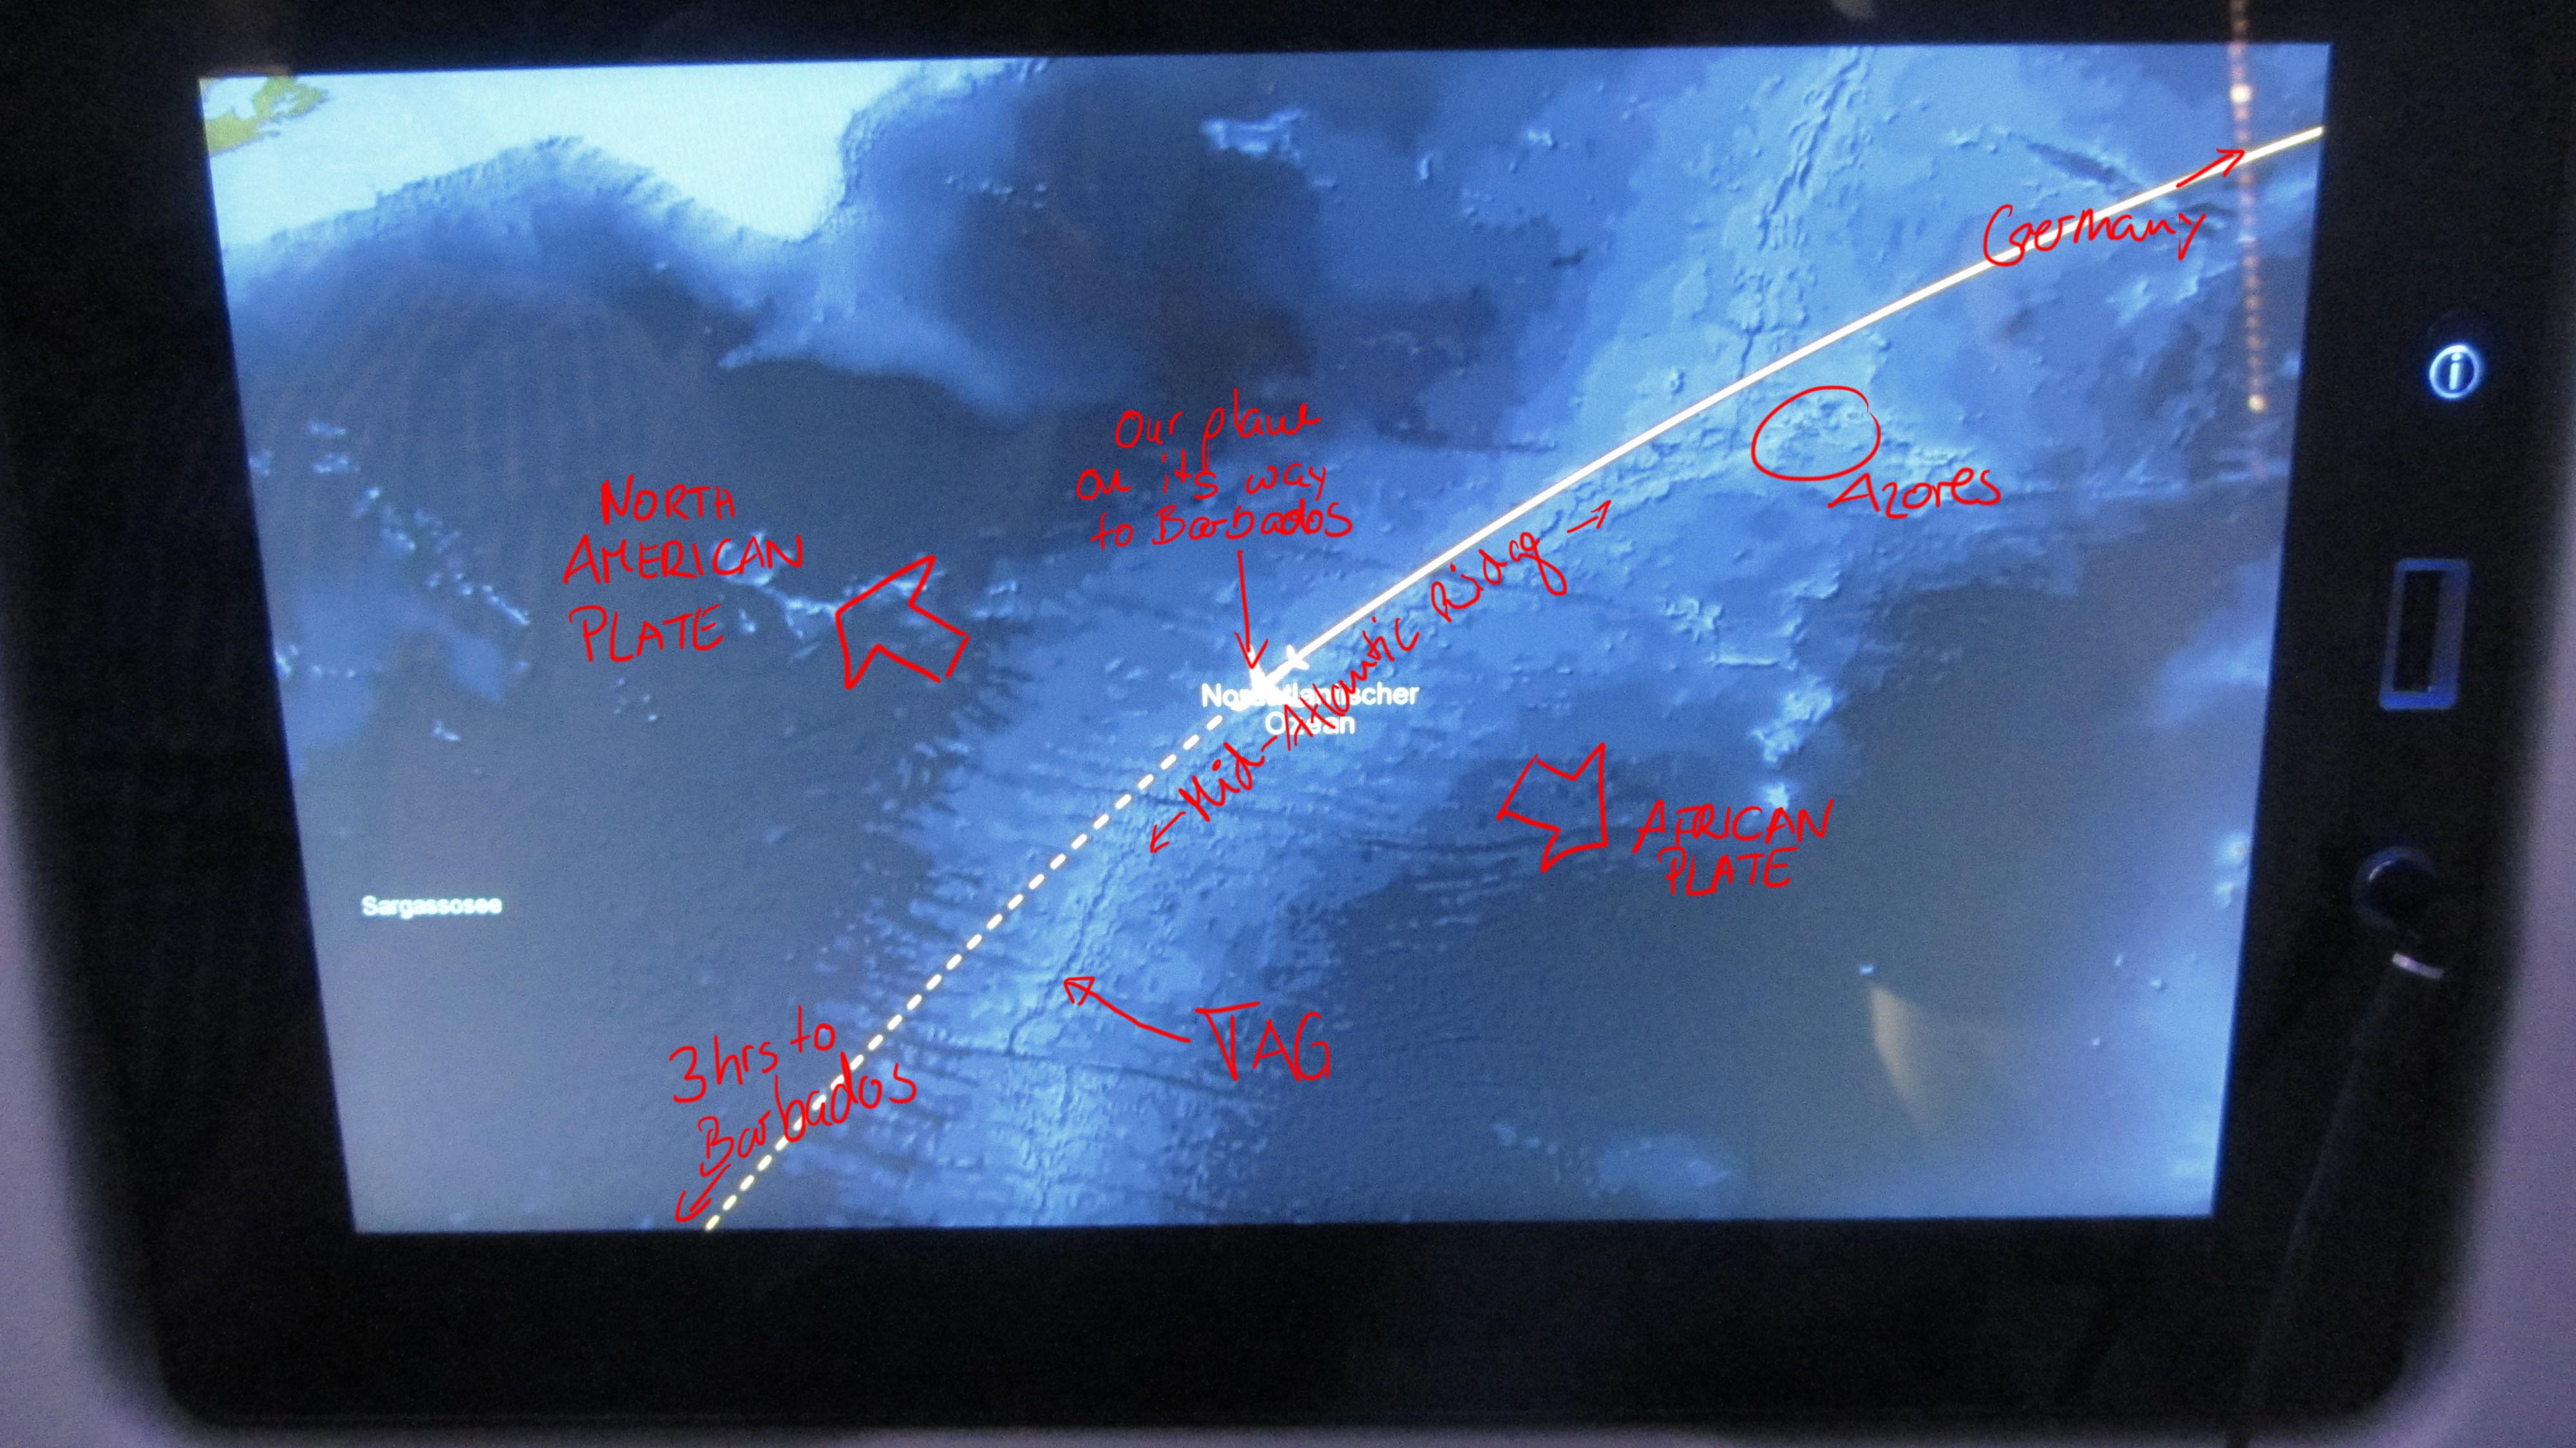
Photo of the info screen on our flight to Barbados with some remarks on what marine geologists see on it: The Mid-Atlantic Ridge (in pale blue colours, as it is shallower than the deep sea plains in dark blue) is a boundary, at which two tectonic plates spread apart. The North American plate, including the continent, moves with a rate of 1cm per year west, while the African and Eurasian plate move with also about 1 cm per year eastwards. The TAG hydrothermal field lies on the plate boundary, which is visible as a fine blue line, due to a graben structure, the so-called rift valley, on top of the Mid-Atlantic Ridge.
/ Foto vom Infobildschirm auf unserem Flug nach Barbados mit einigen Anmerkungen, was Meeresgeologen darauf sehen: Der Mittelatlantische Rücken (als hellblaues Band gut sichtbar, weil er sich von den tiefer gelegenen Tiefseeebenen in dunkelblau abhebt) ist eine Grenze, an der zwei tektonische Platten auseinander spreizen. Die Nordamerikanische Platte, inklusive des Kontinents, bewegt sich mit rund 1 cm pro Jahr nach Westen, während die Eurasische und Afrikanische Platte mit ebenfalls 1 cm pro Jahr nach Osten driften. Das TAG Hydrothermalfeld liegt genau auf der Plattengrenze, die als feine, dunkelblaue Linie auf dem Mittelatlantischen Rücken sichtbar ist, weil sich dort ein tiefer gelegener Graben befindet, das so genannte Rift Valley.
(© Meike Klischies)
—-
1151 Seemeilen geradeaus
Kurs 50 Grad. Nordosten. Geschwindigkeit 10 bis 11 Knoten. Ruhige, blaue See. Ab und an ein vorbeifliegender Vogel. Kaum Wellengang. Seit gut drei Tagen hat sich nichts wirklich geändert und so wird es wohl noch die kommenden zwei Tage weiter gehen, bis wir unser Zielgebiet, das TAG Hydrothermalfeld erreicht haben. Für die Fahrt dorthin, die ein Passagierflugzeug in weniger als vier Stunden zurücklegen würde, benötigt die Meteor fünf Tage.
Warum also schippern wir zu solch einem abgelegenen Ort?
Das TAG Hydrothermalfeld liegt auf dem Mittelatlantischen Rücken in rund 3500 m Wassertiefe. In dem Gebiet befinden sich mehrere inaktive, aber auch aktive heiße Quellen, die metall-reiches, teilweise über 350°C heißes Wasser ausstoßen bzw. ausgestoßen haben. Damit bietet es die einmalige Gelegenheit herauszufinden, was mit solchen heißen Quellen passiert nachdem die Wärmequelle versiegt ist. Verrosten diese Sulfid-Vorkommen einfach am Meeresboden und lösen sich damit langsam auf? Oder bleiben sie für Jahrmillionen unverändert, nur bedeckt von einer dünnen Sediment oder Lavadecke? Wieviel Material gibt es dort eigentlich? Solche Studien sind schwierig durchzuführen, da uns Methoden zum Auffinden solcher inaktiven Vorkommen fehlen. Während unserer Fahrt wollen wir neue Technologien testen, um diese Probleme zu lösen und weiter in die Vergangenheit zu schauen, also weiter weg von den jungen Spreizungsachsen.
Wie wir dieses Problem versuchen anzugehen, und wie wir versuchen werden unsere Fragen zu klären, das wird Thema der nächsten Blogeinträge sein (unter anderem auch hier), wenn wir im Arbeitsgebiet angekommen sind.
Bis dahin bleiben wir weiter auf Kurs und lassen das Fächerecholot laufen, um den Meeresboden unter uns zu kartieren.
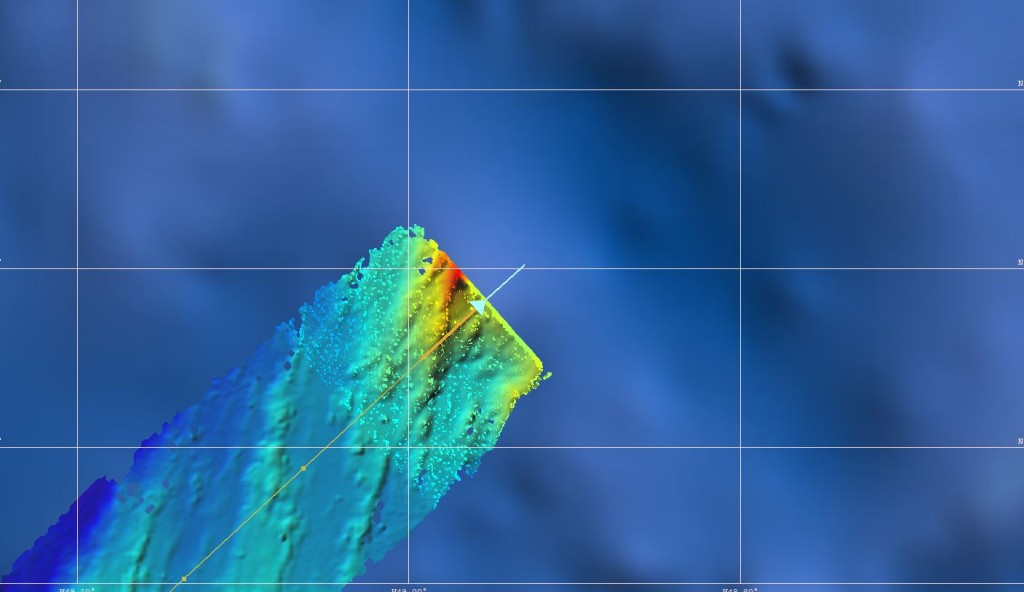
Screenshot from the multi-beam operating system during our transit to the TAG hydrothermal field. The global satellite altimetry dataset is in blue in the background with a spatial resolution of more than a kilometre. In colour is our recorded, ship-based echo-sounder data in a significantly higher resolution (less than 100 m) imaging the seafloor in much more detail. The ship track is in orange and the position and heading of the Meteor is marked by the blue arrow.
/ Bildschirmfoto aus der Fächerecholot-Software während unseres Transits zum TAG Hydrothermalfeld. Im Hintergrund, in blau, liegt der Satellitenaltimetrie-Datensatz mit einer Auflösung von mehreren Kilometern. Darüber liegen unsere frisch aufgezeichneten, schiffsbasierten Daten mit einer deutlich höheren Auflösung (weniger als 100 m), die den Meeresboden mit viel mehr Details abbildet. Unser gefahrener Kurs ist in orange eingezeichnet und der blaue Pfeil markiert die Position und momentane Ausrichtung der Meteor.
(© Meike Klischies)
Do you have any video of that? I’d love to find out more details.
Unfortunately, we do not have a video from our expedition yet.
But on youtube you can find a video-blog from the previous expedition M126. That should give you an impression of work/life on board and in the deep ocean.
Cheers from TAG