— Deutscher Text im Anschluss —
Almost one week into the scientific program of the cruise we already begin to see patterns in the data that seem to support the hypothesis that we want to address here. And that despite many challenges that have kept us improvising over the past week.
Immediately after leaving the national waters of Ireland we began our hydroacoustic mapping program which includes water current data of the upper ca. 500m, seafloor bathymetry (water depth) and the sub-bottom profiling system to look into the upper layers of the seafloor. The route of the vessel was placed in an area where no previous data existed.
Upon reaching our first working area “PAP” (Porcupine Abyssal Plain, ca. 14°39.776W, 47°58.742N) we continued this mapping task for several additional hours. The goal was to better understand the terrain of the area and to provide high-resolution data for the “General bathymetric chart of the oceans” (https://www.gebco.net/).
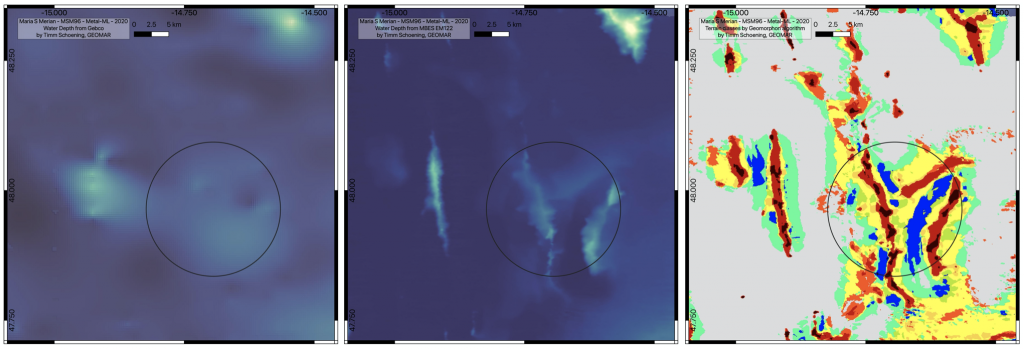
We had chosen the working area as the satellite-derived data showed some of the hill, valley and plain features that we are looking for. The maps we acquired by the multibeam showed more detail and confirmed that we had chosen an appropriate spot for the following sampling sites.
On average, the water depth in the area is about 4800m with one major seamount in the North East rising almost 1000m high above the plains around it. The three parallel ridges in the southern half of the map rise between 300m and 500m and extend about 25km in North-South direction and about 3km in East-West direction.
We classified the depth map by the Geomorphons algorithm which provided us with distinct areas for our planned sampling scheme (https://doi.org/10.1016/j.geomorph.2012.11.005). The algorithm assigns each part of the map to one of ten distinct types. We are aiming our sampling and observation on three of those terrains: hills (red), plains (grey) and valleys (blue).
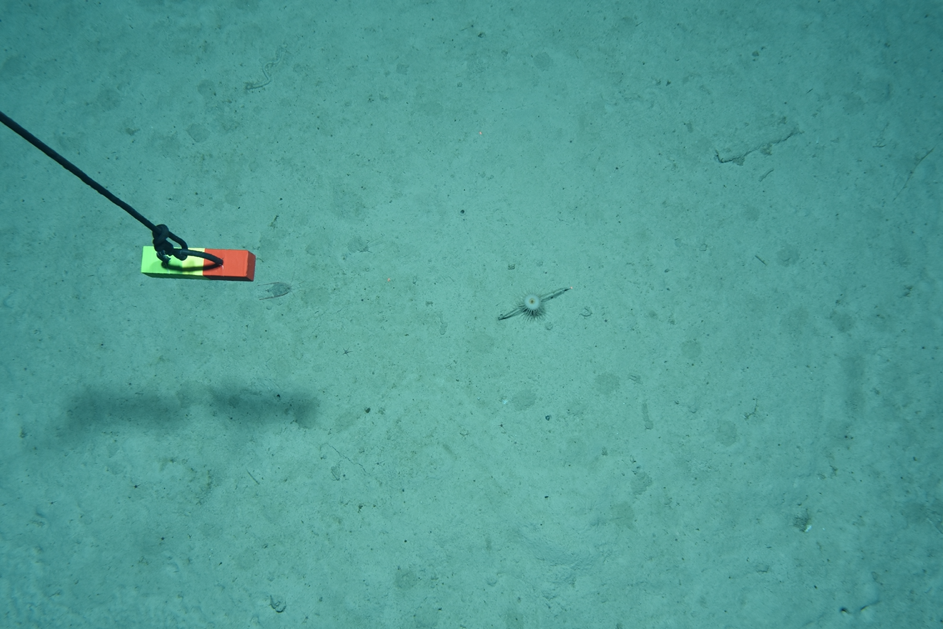
On top of the echo-sounding work for the map, all the other equipment on board has kept the science and ship’s crews busy as well. We have been collecting water samples, sediment samples and have been taking images of the seafloor.
Anyhow, the planned science program was often challenged in this first week either by technical failures or weather conditions. This means that we had to adjust the work plans frequently to exchange equipment that could not currently be deployed. Despite these delays, we managed to survey two parts of the area by the towed camera platform and sample three sites by the multi-corer. From the – very preliminary – observations and data, we believe that we can already see the subtle differences between terrain types that we hoped to detect. Should the further incoming data underline these observations we could better understand – and quantify – the variability of the geochemical and faunal composition in this first area.
In two or three days we will leave this first area and head out into the Atlantic to repeat the mapping, sampling and observation in two more areas. The combined data on variabilities within one area and between the areas will enable the science community to incorporate that knowledge into process models and predictions.
Fingers crossed that me manage to acquire more of the needed data and that the gear remains intact and the weather remains calm.
Kartierung
Fast eine Woche nach Beginn des wissenschaftlichen Programms der Ausfahrt beginnen wir bereits Muster in den Daten zu erkennen, die die Hypothese, die wir hier untersuchen wollen, zu unterstützen scheinen. Und das trotz vieler Herausforderungen, die uns in der vergangenen Woche zum Improvisieren gezwungen haben.
Unmittelbar nachdem wir die Wirtschaftszone Irlands verlassen hatten, also internationale Gewässer erreichten, begannen wir mit unserem hydroakustischen Kartierungsprogramm, das Strömungsdaten der oberen ca. 500 m, die Bathymetrie des Meeresbodens (Wassertiefe) und das System zur Untersuchung der oberen Schichten des Meeresbodens umfasst. Die Route des Schiffes wurde dafür in ein Gebiet gelegt, in dem keine früheren Daten existierten.
Nachdem wir unser erstes Arbeitsgebiet “PAP” (Porcupine Abyssal Plain, ca. 14°39.776W, 47°58.742N) erreicht hatten, setzten wir diese Kartierungsarbeit für einige zusätzliche Stunden fort. Ziel war es, das Gelände des Arbeitsgebietes besser zu verstehen und hochauflösende Daten für die “General Bathymetric Chart of the Oceans” (www.gebco.net) zu liefern.
Wir hatten das Arbeitsgebiet ausgewählt, da die von den Satelliten gemessenen Daten einige der von uns gesuchten Hügel-, Tal- und Ebenen-Merkmale zeigten. Die Karten, die wir mit dem Multibeam aufgenommen haben, zeigten mehr Details und bestätigten, dass wir einen geeigneten Ort für die folgende Probenahme gewählt hatten.
Im Durchschnitt beträgt die Wassertiefe in unserem Arbeitsgebiet etwa 4800 m, wobei ein großer Seebberg im Nordosten fast 1000 m hoch über die ihn umgebenden Ebenen hinausragt. Die drei parallelen Bergrücken in der südlichen Hälfte der Karte erheben sich zwischen 300 m und 500 m und erstrecken sich etwa 25 km in Nord-Süd-Richtung und etwa 3 km in Ost-West-Richtung.
Im Anschluss haben wir haben die Tiefenkarte mit Hilfe des Geomorphons-Algorithmus klassifiziert, der uns Bereiche für unser geplantes Probenahmeschema lieferte (https://doi.org/10.1016/j.geomorph.2012.11.005). Der Algorithmus ordnet jeden Teil der Karte einem von zehn verschiedenen Typen zu. Wir richten unsere Probenahme und Beobachtung auf drei dieser Terrains aus: Hügel (rot), Ebenen (grau) und Täler (blau).
Neben der Echolot-Arbeit für die Karte haben auch alle anderen Geräte an Bord die Wissenschaft und die Schiffsbesatzungen beschäftigt. Wir haben Wasserproben und Sedimentproben gesammelt und Bilder vom Meeresboden aufgenommen.
Jedoch wurde das geplante wissenschaftliche Programm in dieser ersten Woche einige Male durch technische Ausfälle oder Wetterbedingungen ausgebremst – wie zu erwarten unter den schwierigen Bedingungen im erst im Nordatlantik. Das bedeutet, dass wir die Arbeitspläne häufig anpassen mussten, um Geräte auszutauschen, die derzeit nicht eingesetzt werden konnten. Trotz dieser Verzögerungen gelang es uns, zwei Teile des Gebietes mit der geschleppten Kameraplattform zu vermessen und drei Positionen mit dem Multi-Corer zu beproben. Anhand der – sehr vorläufigen – Beobachtungen und Daten glauben wir, dass wir bereits die subtilen Unterschiede zwischen den Geländetypen erkennen können, die wir zu entdecken hofften. Sollten die weiteren eingehenden Daten diese Beobachtungen untermauern, könnten wir die Variabilität der geochemischen Zusammensetzung in diesem ersten Gebiet besser verstehen – und quantifizieren.
In zwei oder drei Tagen werden wir dieses erste Arbeitsgebiet schon wieder verlassen und weiter in den Atlantik hinausfahren, um die Kartierung, Probenahme und Beobachtung in zwei weiteren Gebieten zu wiederholen. Die kombinierten Daten über die Variabilitäten innerhalb eines Gebietes und zwischen den Gebieten werden es hoffentlich ermöglichen, dieses Wissen in Prozessmodelle und Vorhersagen einfließen zu lassen.
Wir hoffen, noch deutlich mehr der benötigten Daten zu gewinnen, dass die Ausrüstung intakt und das Wetter ruhig bleibt.